Variance Analysis
The Variance Analysis page compares two periods or scenarios side by side and surfaces every line where the numbers differ. Use it to compare actuals against budget, this period against last period, this year against last year, or any combination of scenarios. Drill into any line to see the variance visualized and add commentary explaining the difference.
Why this matters
Variance is where finance conversations actually live. "Why did this go up?" and "Why did this miss?" are the questions a CFO, board, or auditor wants answered, and Variance Analysis is the page built for those questions. By showing the difference and the percentage variance for every account in one view, then letting you click into any line for charts and comments, it turns the period close from a list of numbers into a structured discussion.
When to use this
- During your monthly close to compare actuals against your forecast or budget
- When preparing board or leadership commentary on monthly variances
- When investigating a number that looks off before raising it with a teammate
- When responding to audit or lender requests for variance explanations
Before You Start
Make sure you have:
- A connected data source so actuals are loaded for the period you want to analyze
- Your Base Case scenario configured, plus any other scenarios you want to compare against
- Your Chart of Accounts reviewed in Setup, Chart of Accounts so accounts roll up correctly
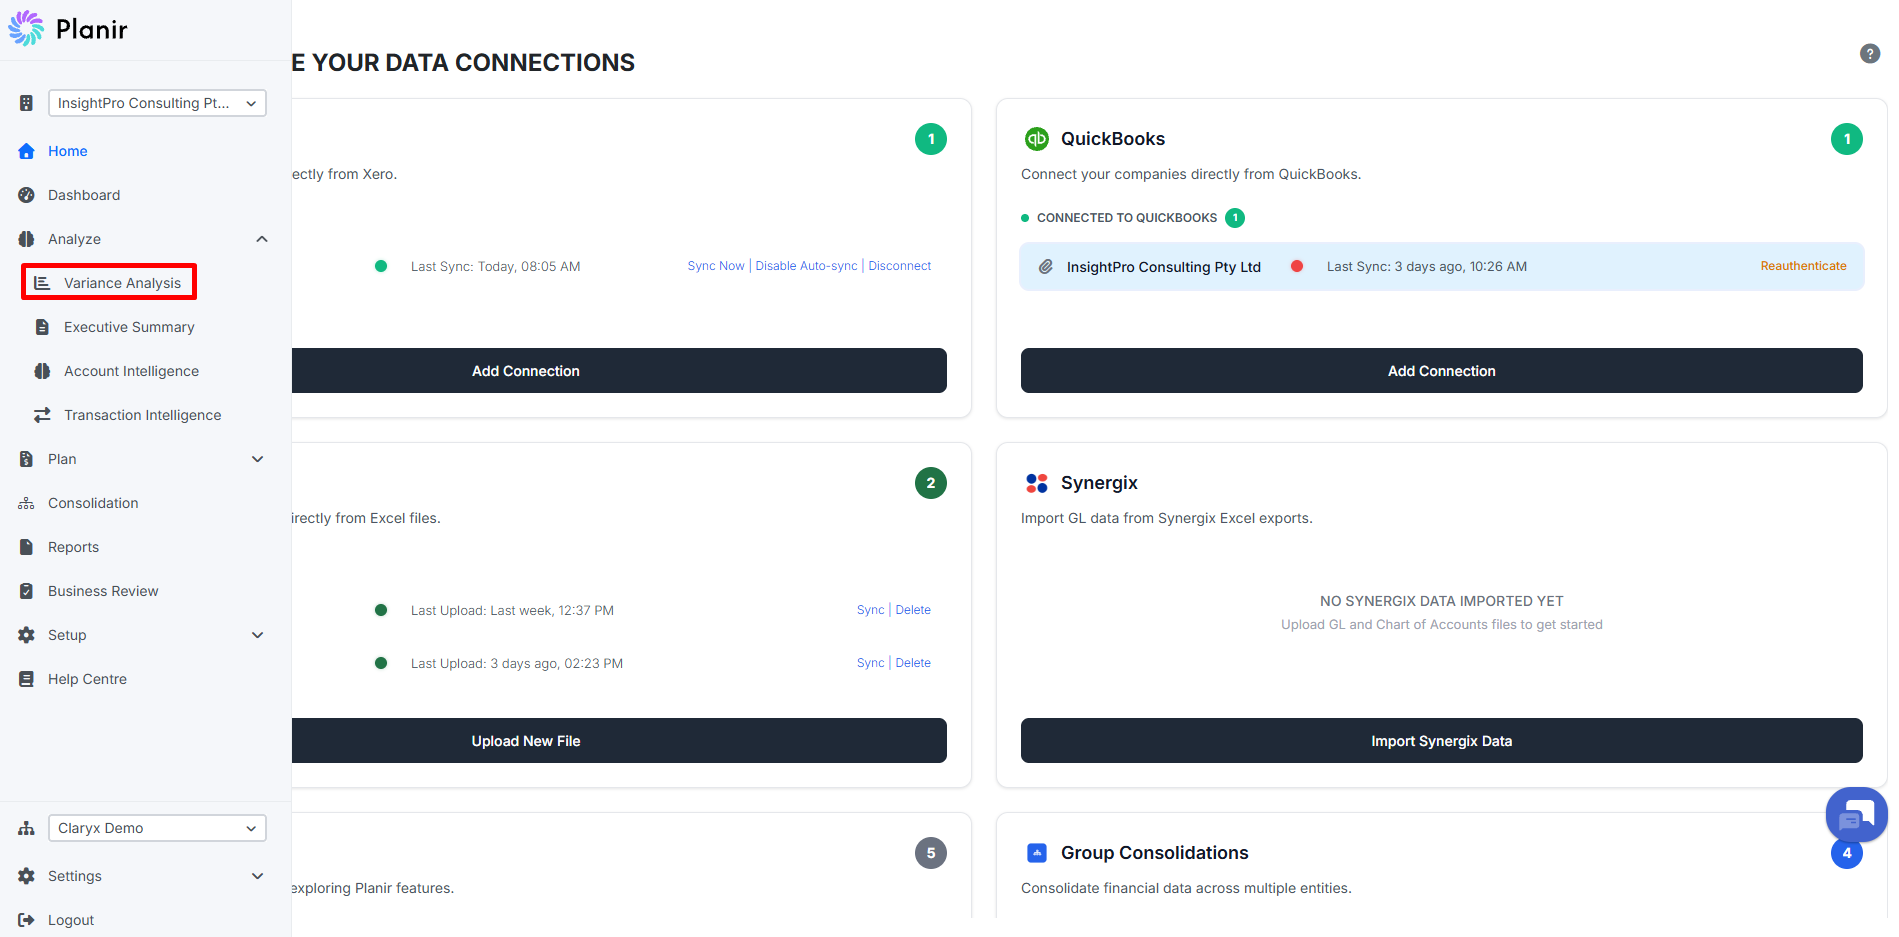
Step 1. Open the Variance Analysis Page
- From the sidebar, expand Analyze.
- Click Variance Analysis.
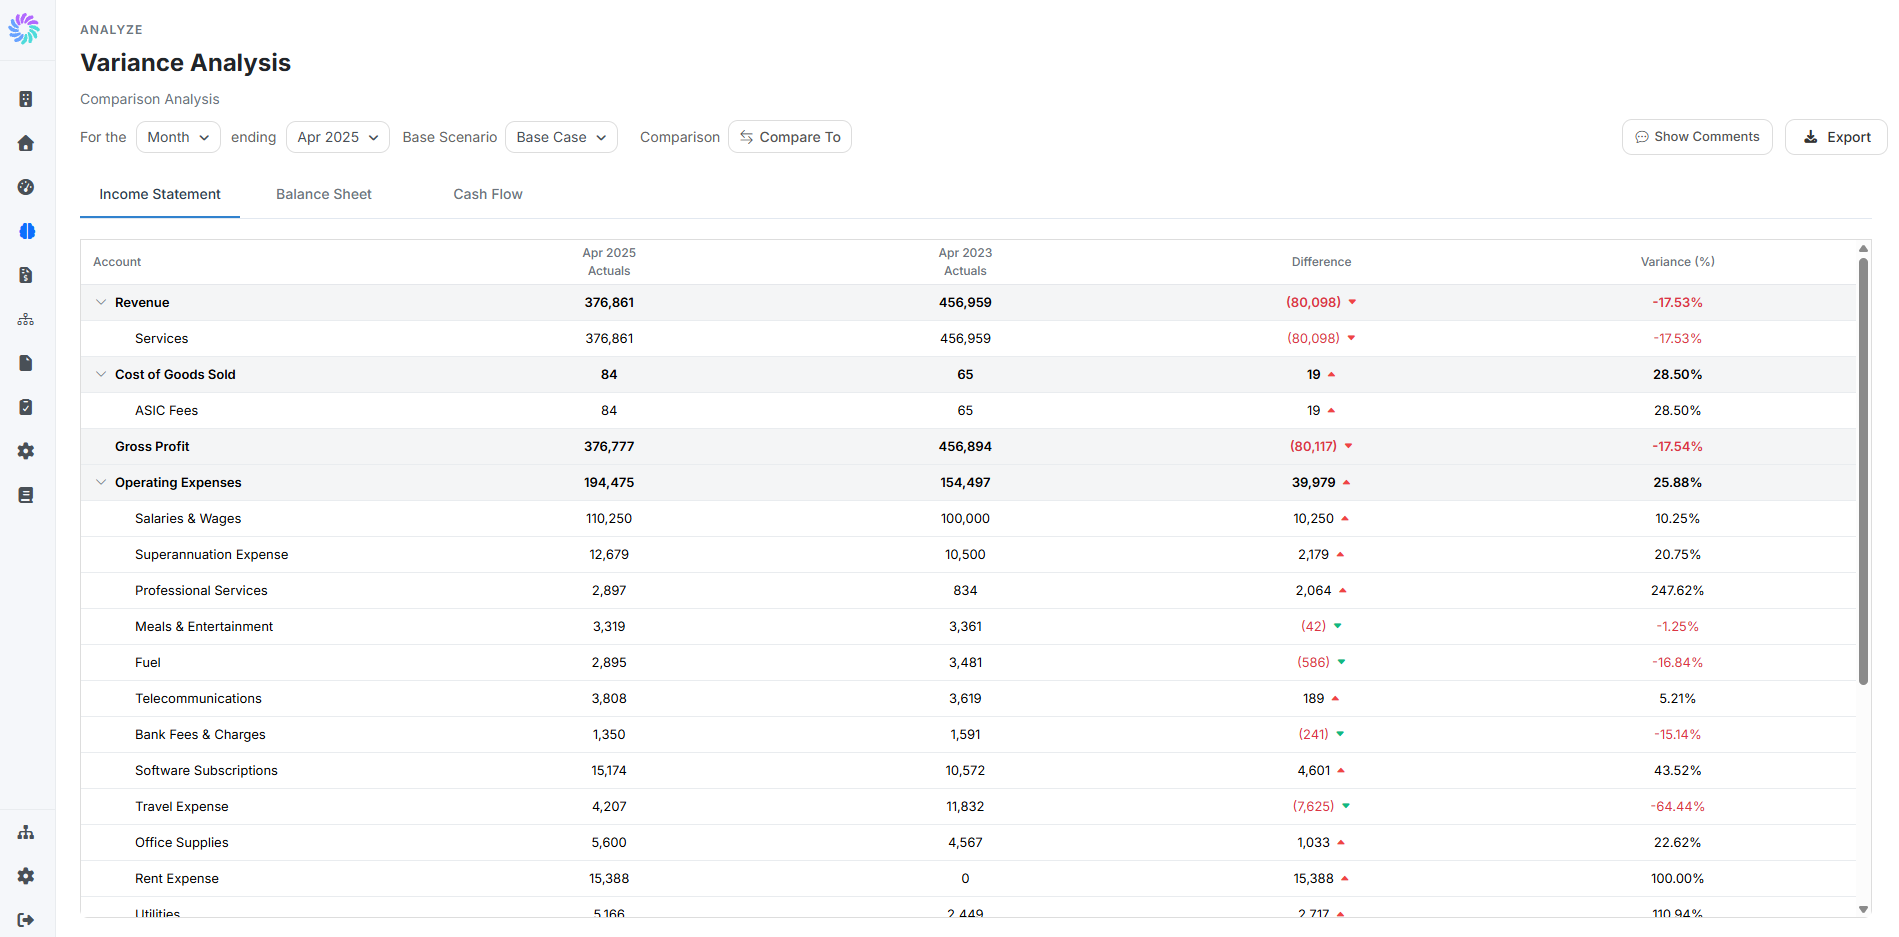
The page opens with three tabs across the top: Income Statement, Balance Sheet, and Cash Flow. By default it compares the most recent period in the active scenario.
Step 2. Set the Periods to Compare
The controls at the top of the page define the comparison:
- For the [Month] ending [Date]: choose the period type (Month, Quarter, Year) and end date for the first period in the comparison
- Base Scenario: the scenario the first period is based on (typically Actuals or Base Case)
- Compare To: opens a small panel where you pick the second period and scenario you want to compare against
The two columns in the table reflect what you set: the first column shows the chosen period and scenario, the second column shows the comparison period and scenario, and the Difference and Variance (%) columns show the gap between them.
Step 3. Read the Variance Columns
Every row shows four numbers across the table:
- Period A column: the value for the primary period and scenario
- Period B column: the value for the comparison period and scenario
- Difference: Period A minus Period B, shown in the same units as the underlying line. Negative differences show in red with a down-arrow; positive differences show in green with an up-arrow.
- Variance (%): the percentage variance between the two values
Use the chevron next to any group (Revenue, Cost of Goods Sold, Operating Expenses, Assets, Liabilities, etc.) to expand or collapse its child accounts.
The three tabs let you variance-analyze each statement independently:
- Income Statement: revenue, cost, and profitability variances
- Balance Sheet: asset, liability, and equity variances at period-end
- Cash Flow: operating, investing, and financing activity variances
Step 4. Explain the Variance with a Comment
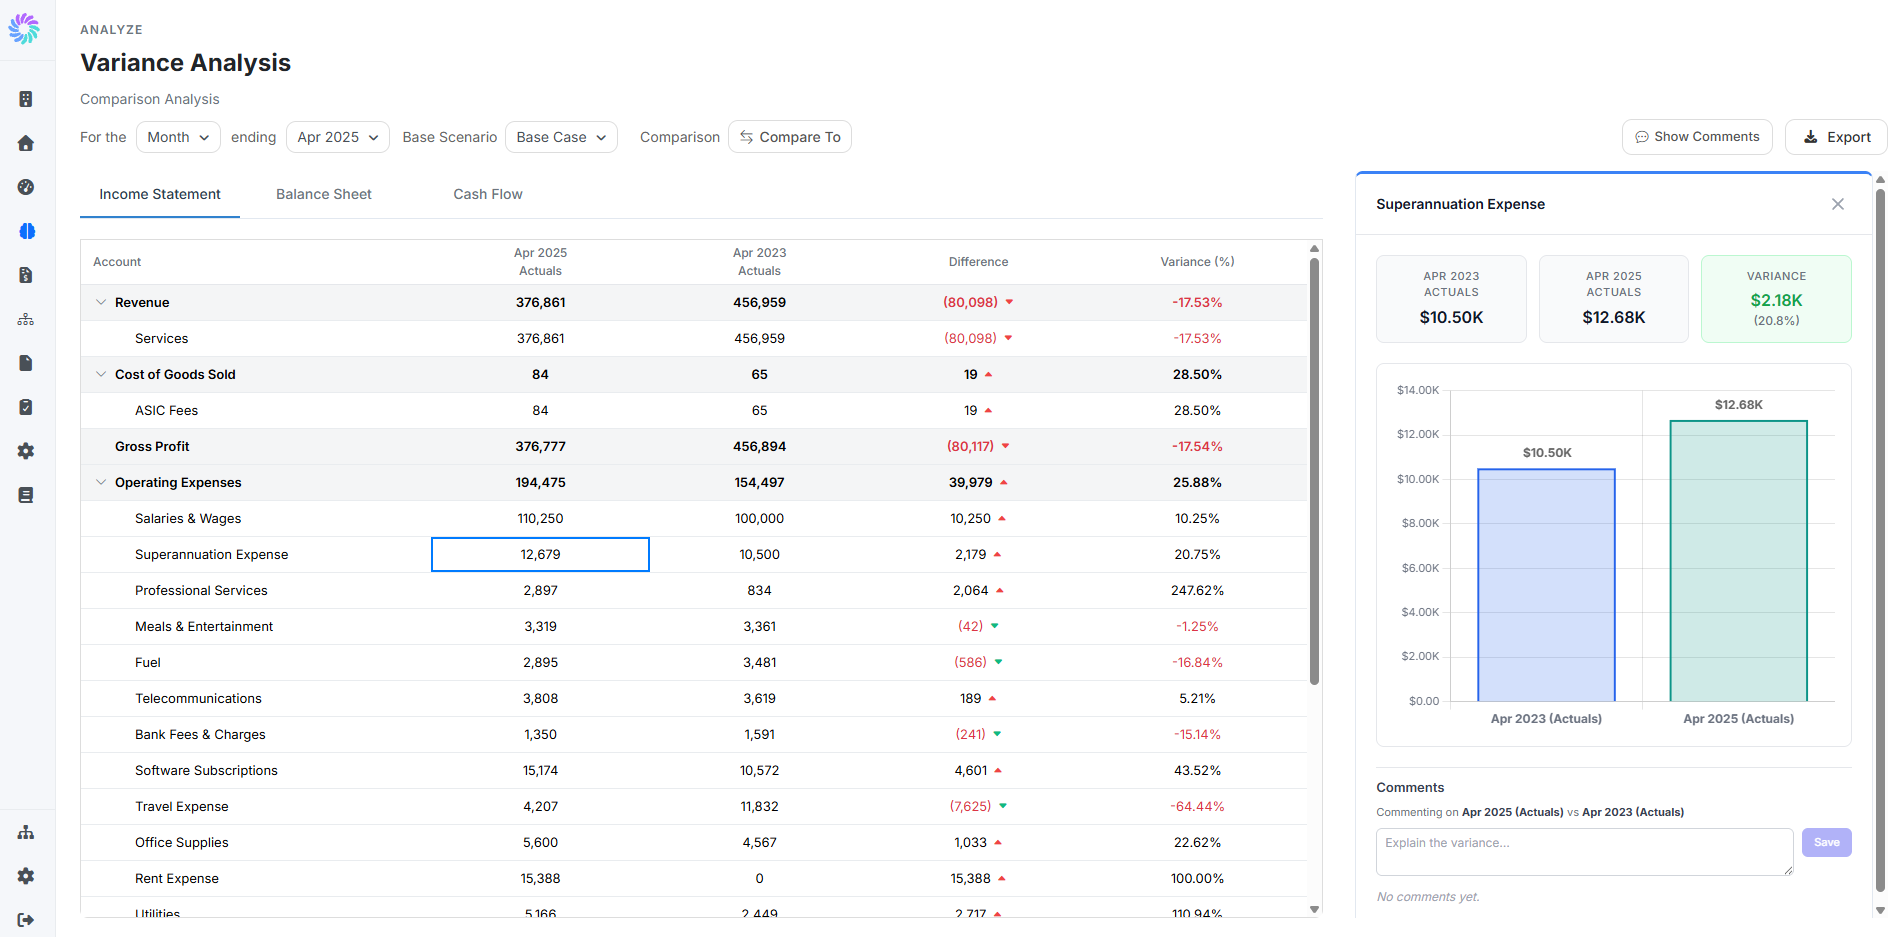
The detail panel includes a Comments section specific to the period and scenario combination you are looking at.
- Type an explanation in the Explain the variance field.
- Click Save.
The comment is attached to that specific line and that specific comparison, so anyone reviewing the same variance later sees the explanation in context. This is especially useful when preparing board commentary or responding to audit requests, since the explanations live with the numbers rather than in a separate document.
Use the Show Comments button in the top right of the page to expand all variance comments at once.
Step 5. Export the Analysis
Click Export CSV in the top right of the page to download the current variance view as a CSV file. Useful for sharing with stakeholders who do not have a Planir login or for pasting into a board pack.