Transaction Intelligence
The Transaction Intelligence page lets you drill from account-level numbers down to the individual transactions that make them up. Browse, search, and filter the transaction ledger for any month, then click into any line to see the transaction's full payment history, customer behavior, and 12-month context. Multi-select to subtotal a set of transactions, compare them side by side, mark transactions as reviewed during your close, and export the list when you need it outside Planir.
Why this matters
Every other Analyze page summarizes. Transaction Intelligence is where you see the raw rows and decide what is real. When a number on the income statement looks off, the question is always "which transactions made up that number?" This page answers it without making you flip into the source ledger. The right-panel intelligence (customer transaction history, payment behavior, on-time rate) is what makes it more than a CSV viewer: you get context that helps you decide whether the transaction is normal, anomalous, or worth a follow-up.
When to use this
- During monthly close, to review and tick off transactions account by account
- When investigating a variance and you need to see the underlying transactions
- When checking customer payment behavior before approving a credit limit or chasing an invoice
- When auditing or sampling, to pick a few transactions, see their payment context, and mark them reviewed
- When you need a filtered transaction list for a stakeholder who does not have a Planir login
Before You Start
Make sure you have:
- Connected data sources so transactions are loaded for the month you want to review
- The correct entity or group selected in the sidebar dropdown
- A clear question or close checklist in mind, so you know which accounts and which transactions to focus on
Step 1. Open Transaction Intelligence
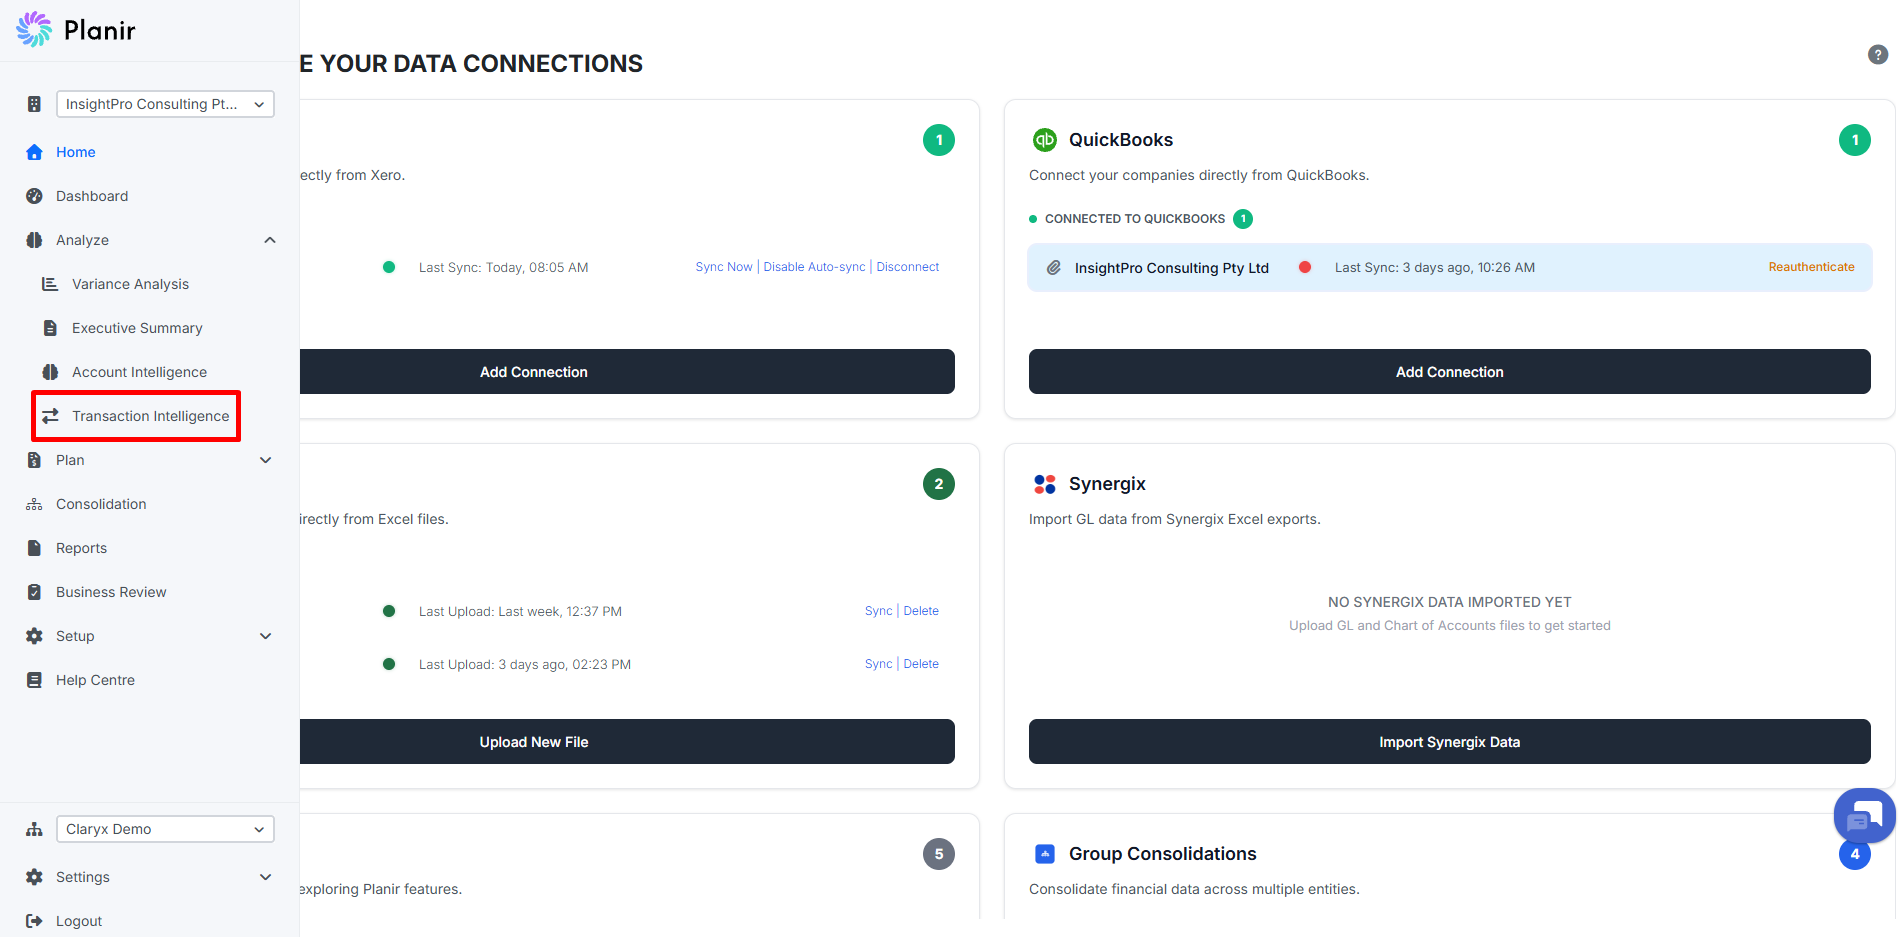
- From the sidebar, expand Analyze.
- Click Transaction Intelligence.
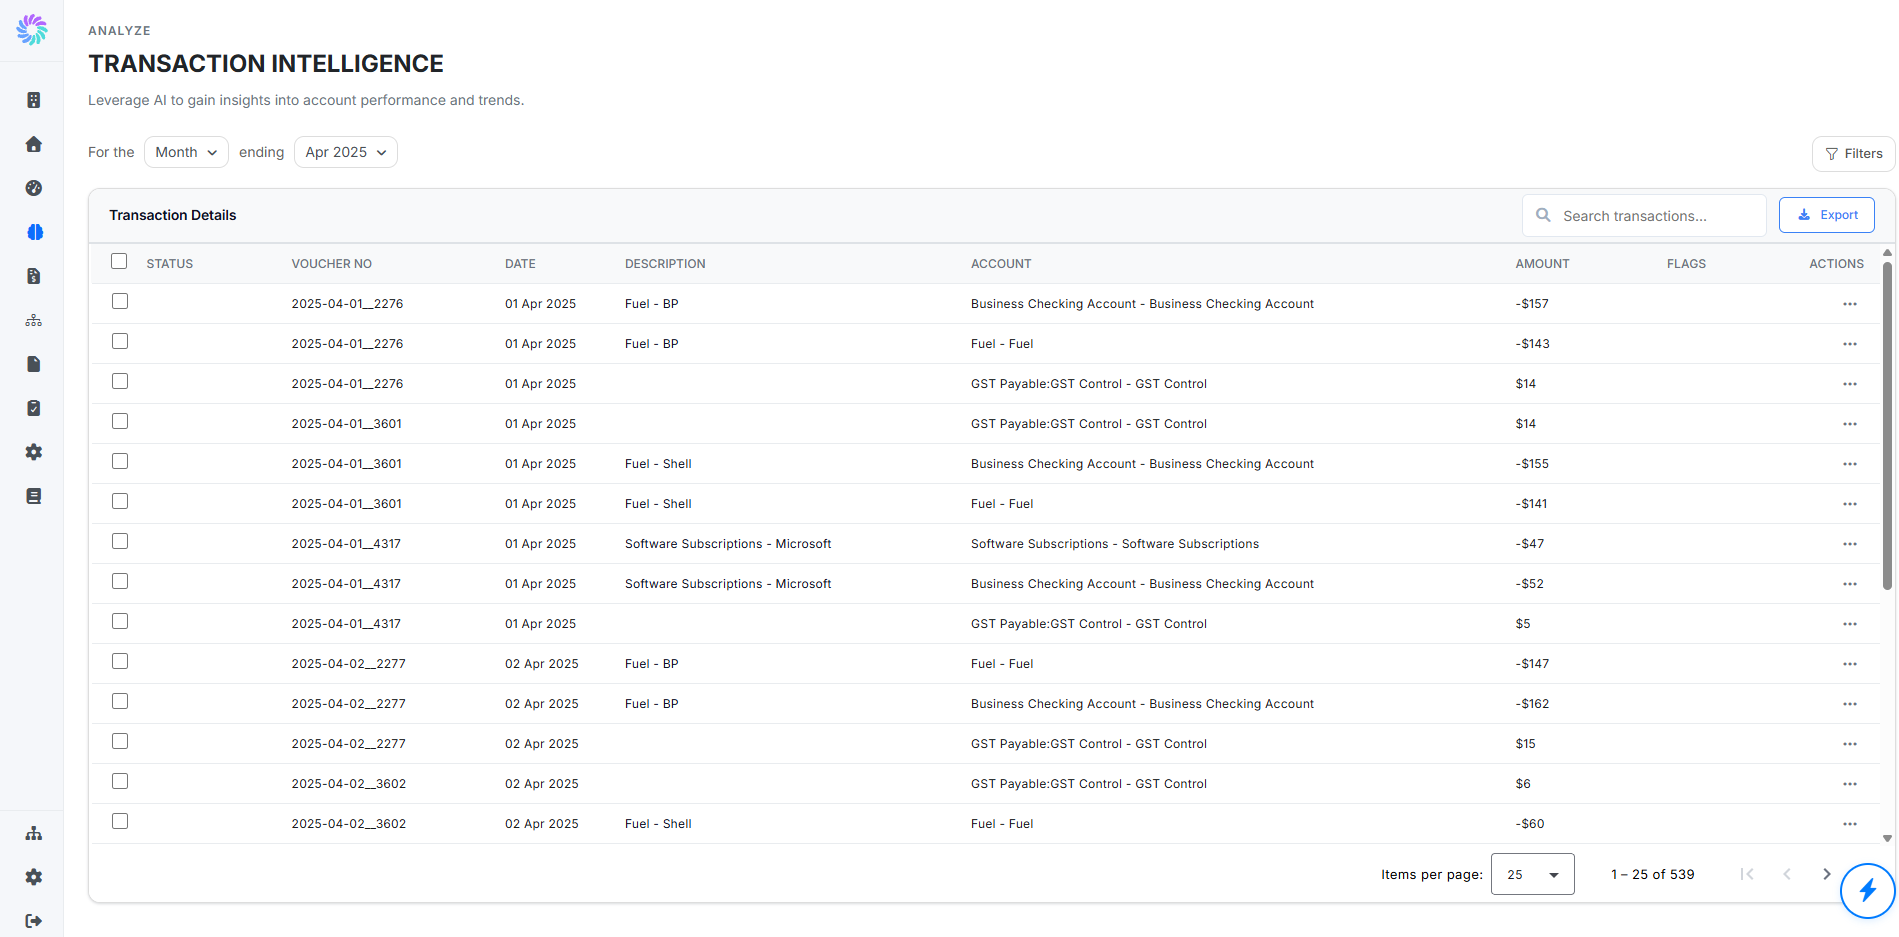
The page opens with the period set to the current month, default account filters applied (the Filters badge shows the active count), and the Transaction Details table listing every transaction in scope. The table has these columns:
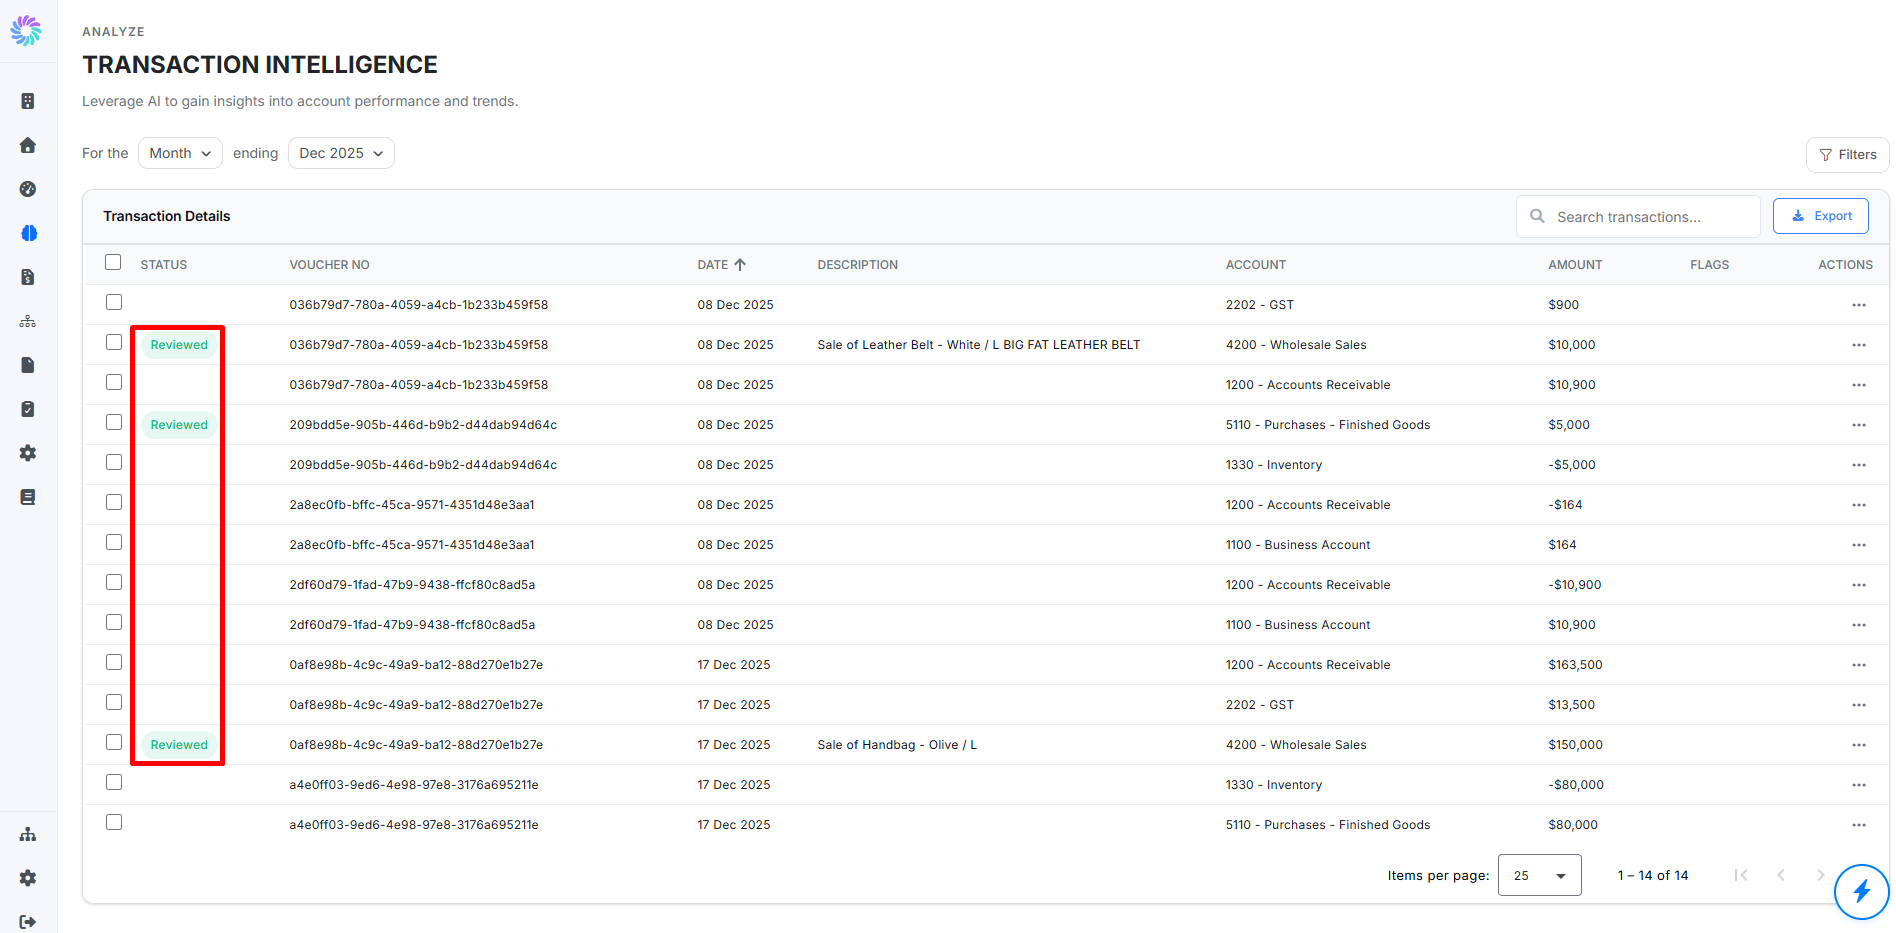
- Status: a green Reviewed badge appears once the transaction has been marked off (see Step 6)
- Date: the transaction date
- Description: the transaction description
- Contact: the customer or supplier
- Account: the GL account the transaction posts to
- Amount: the transaction value
- Flags: any AI-flagged anomalies on this row
- Actions: the per-row menu (...)
Use the Search transactions field above the table to filter by description, contact, or account. Use the Items per page selector and pagination arrows at the bottom of the table to navigate large result sets (for example, "1 – 25 of 228").
Step 2. Set the Period
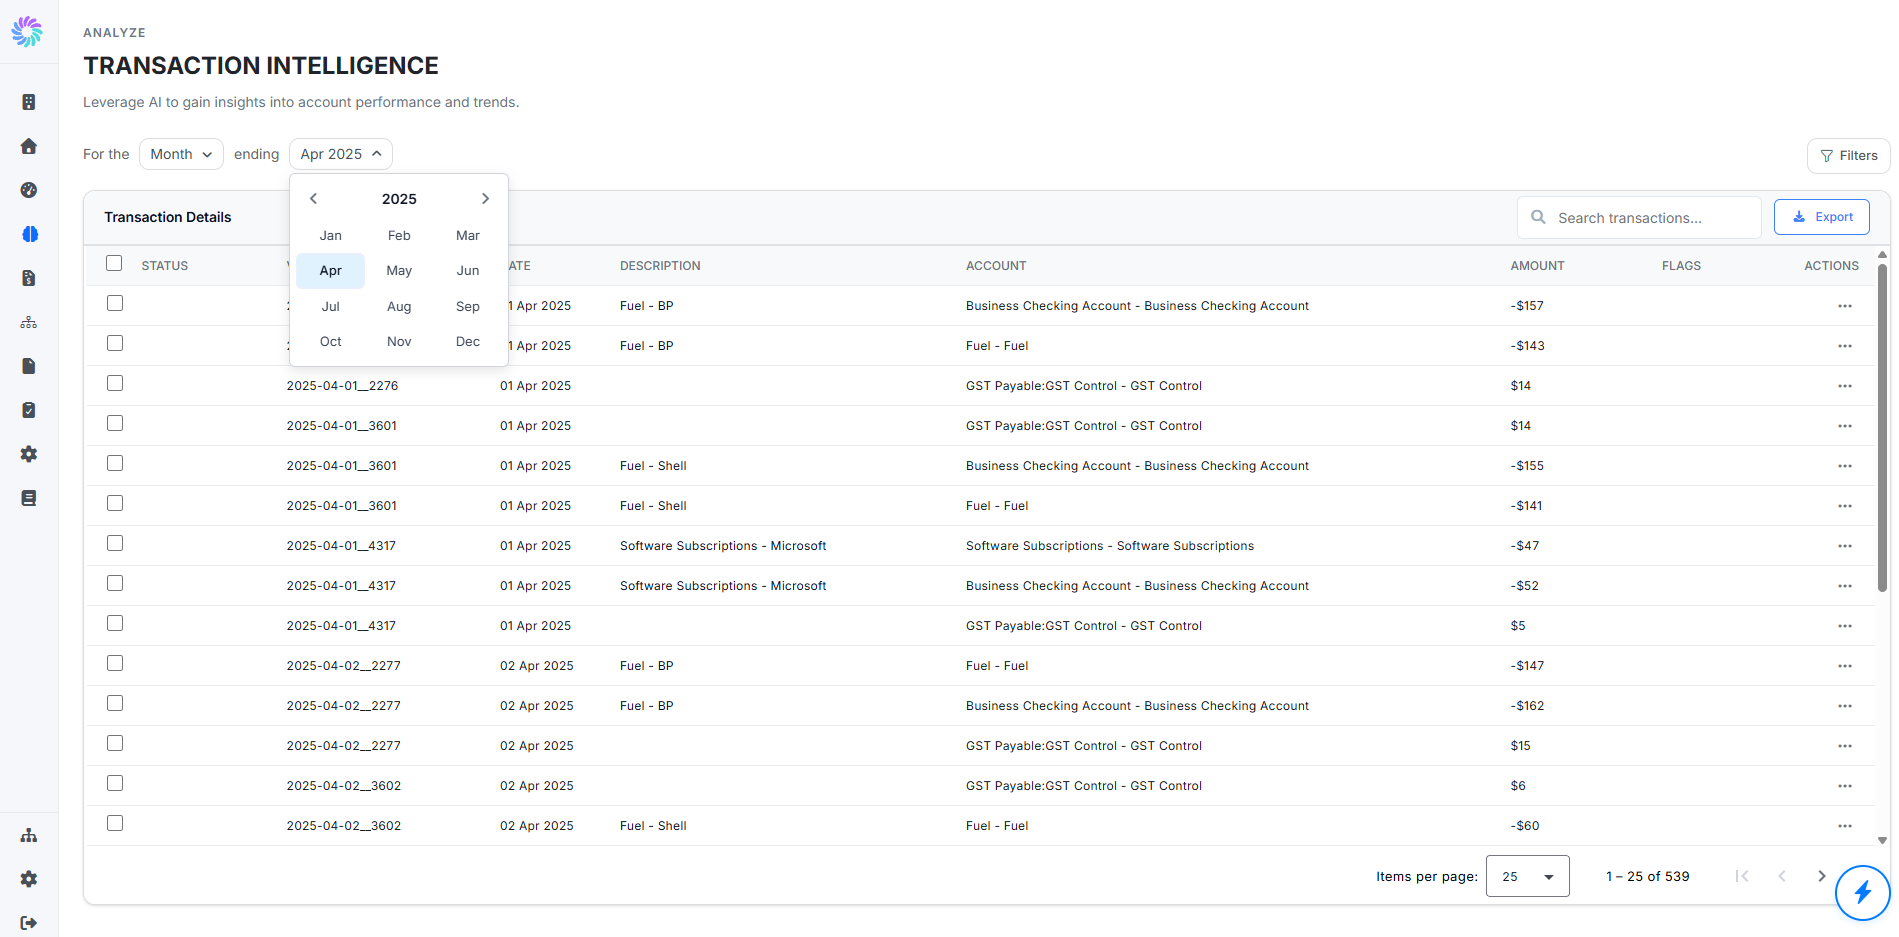
The For the [Month] ending [Date] control at the top of the page selects which month of transactions to show. Click the date to open the month picker, use the arrows to change year, and click the month you want. The list refreshes immediately.
Transaction Intelligence is a single-month view by default, so you do not need to set a comparison period as you would on Variance Analysis.
Step 3. Filter by Account
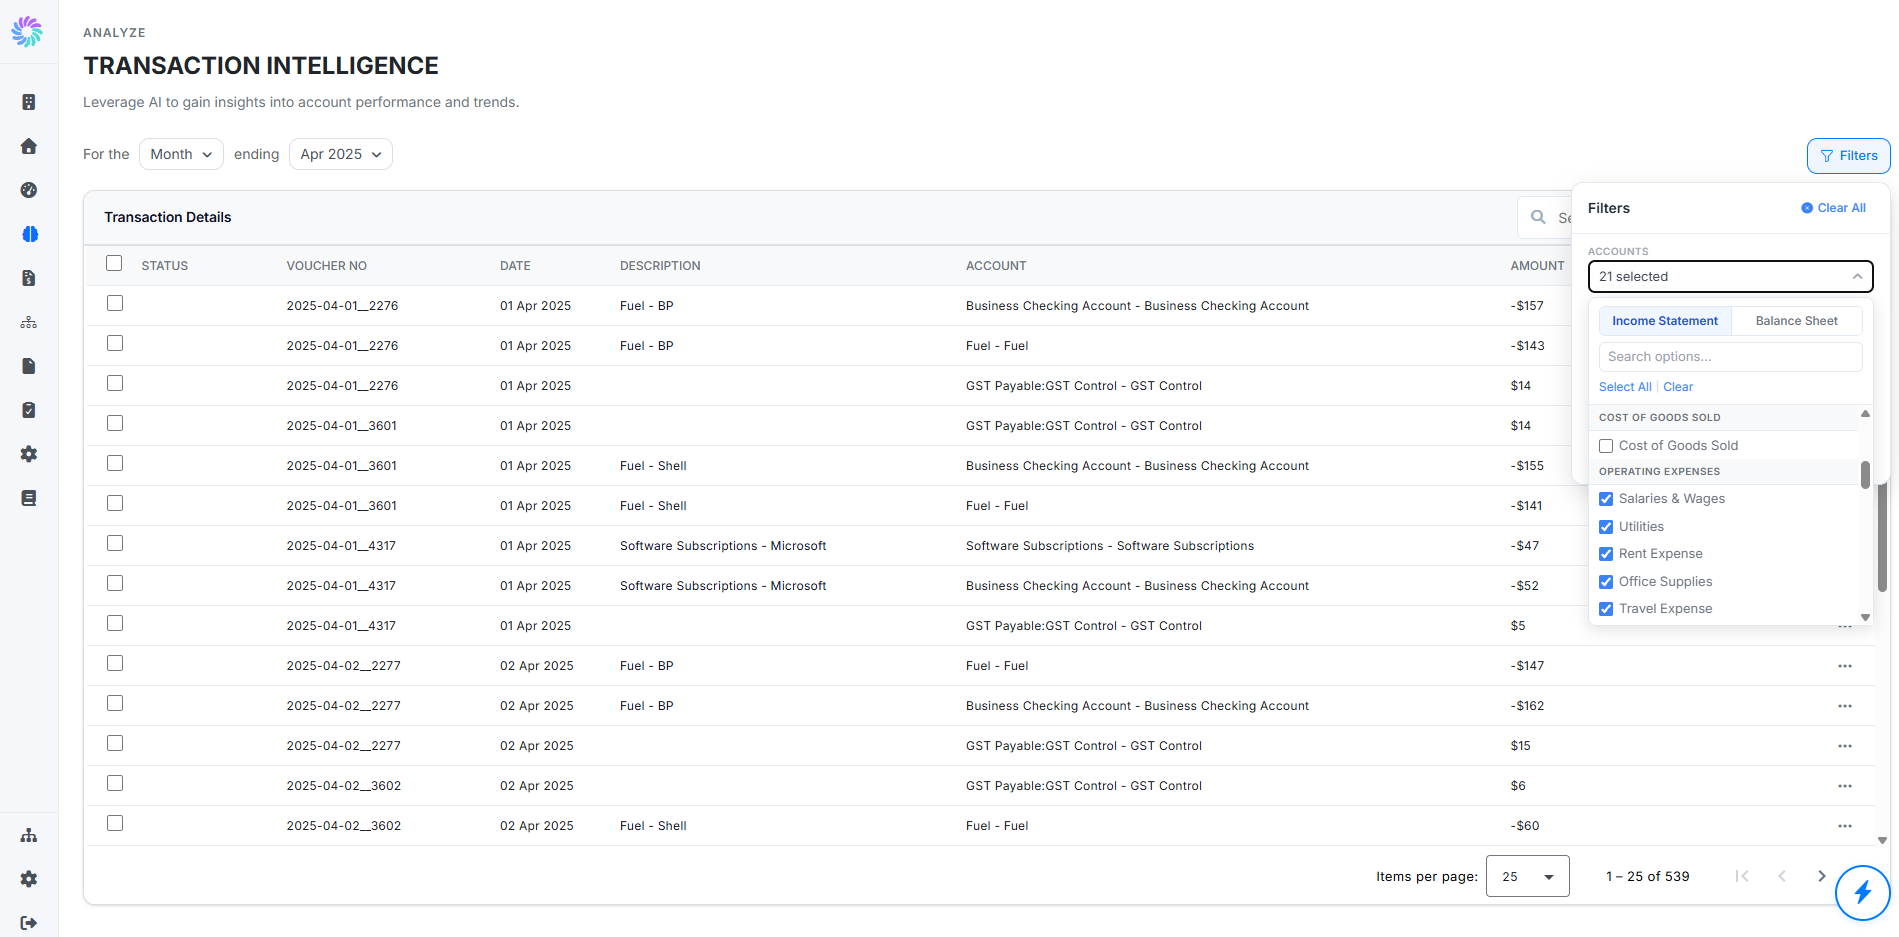
Click the Filters button at the top right of the page to open the filters panel. The panel has:
- Accounts: the count of accounts currently included (for example, "14 selected") with a dropdown to refine the selection
- Tabs: Income Statement and Balance Sheet to switch between statement views
- Search accounts: type to filter accounts by name or code
- Select All | Clear: toggle the entire list at once
- Account tree: accounts grouped by category (Revenue, Cost of Goods Sold, and so on) with checkboxes to include or exclude each one
The transaction list updates as you change the selection, and the Filters badge at the top right shows the number of active filters.
Step 4. Inspect a Single Transaction
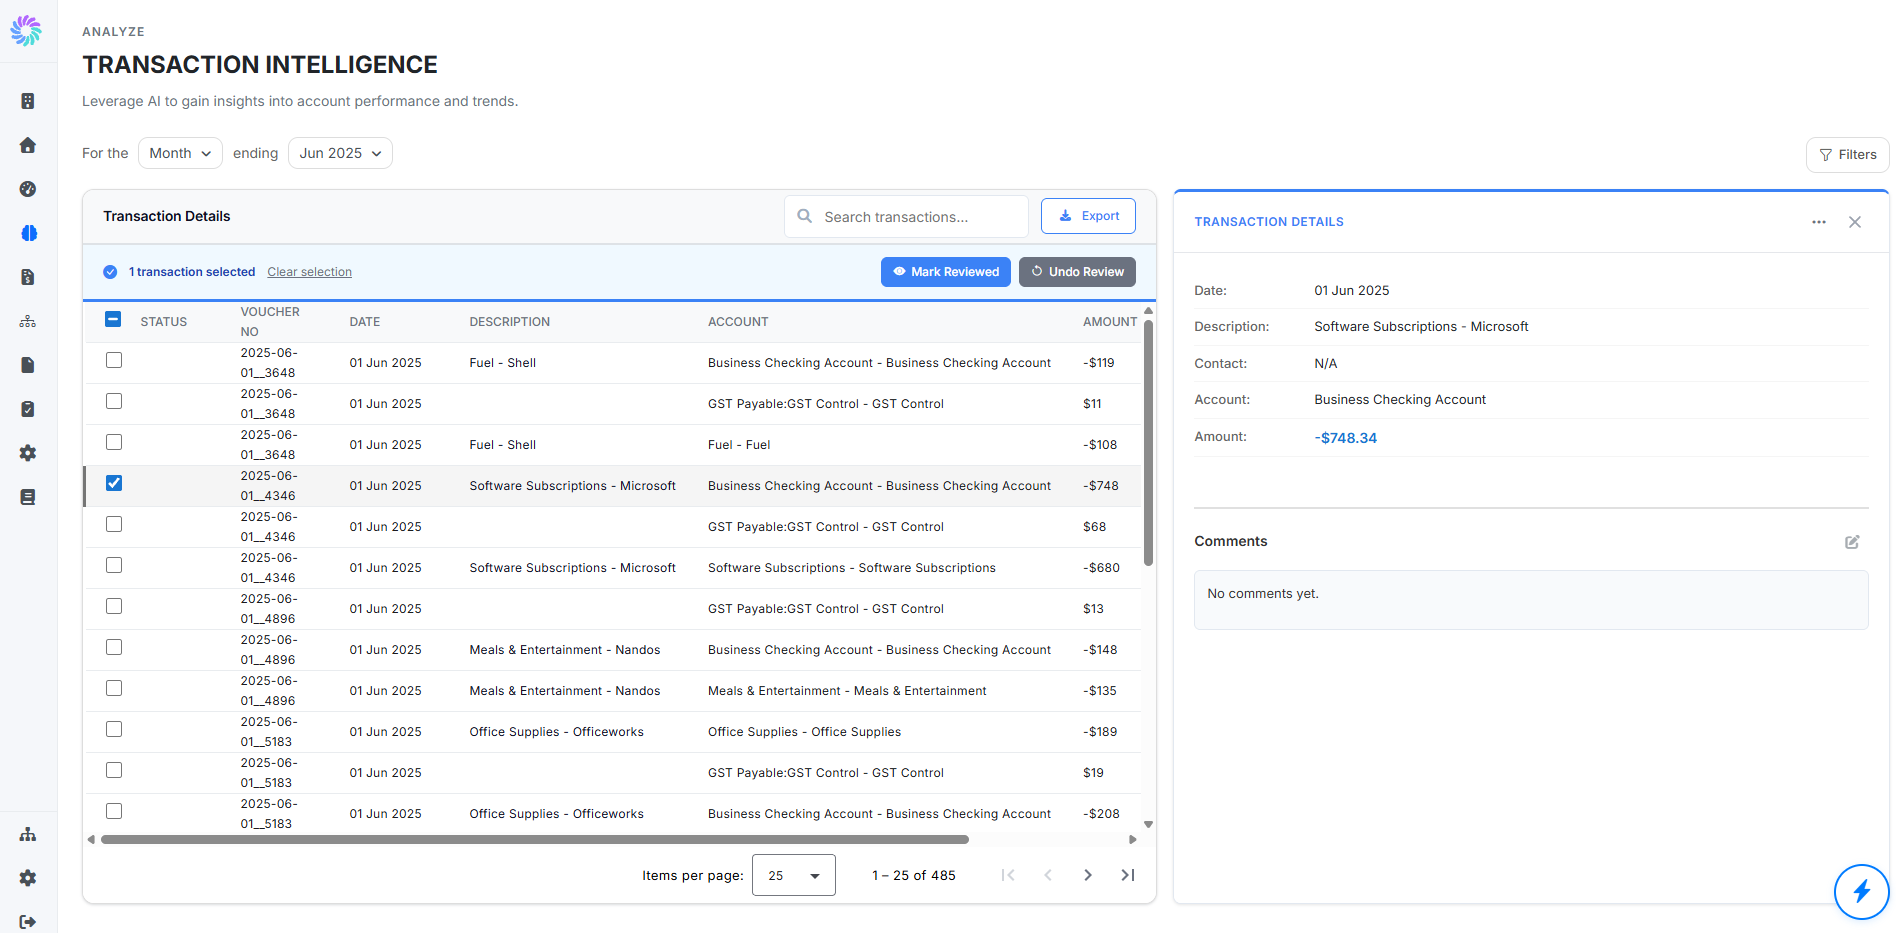
Click any row in the table to open the Transaction Details panel on the right. The panel pulls together everything you need to judge the transaction in context:
- Header: Date, Description, Contact, Account, and Amount
- Comments: a thread for notes or queries about this transaction
The detail panel is the heart of the page. Use it to confirm, for example, that a customer who paid late once is otherwise an on-time payer, or to spot a transaction that looks normal in the list but has an unusual payment status.
Step 5. Compare Multiple Transactions
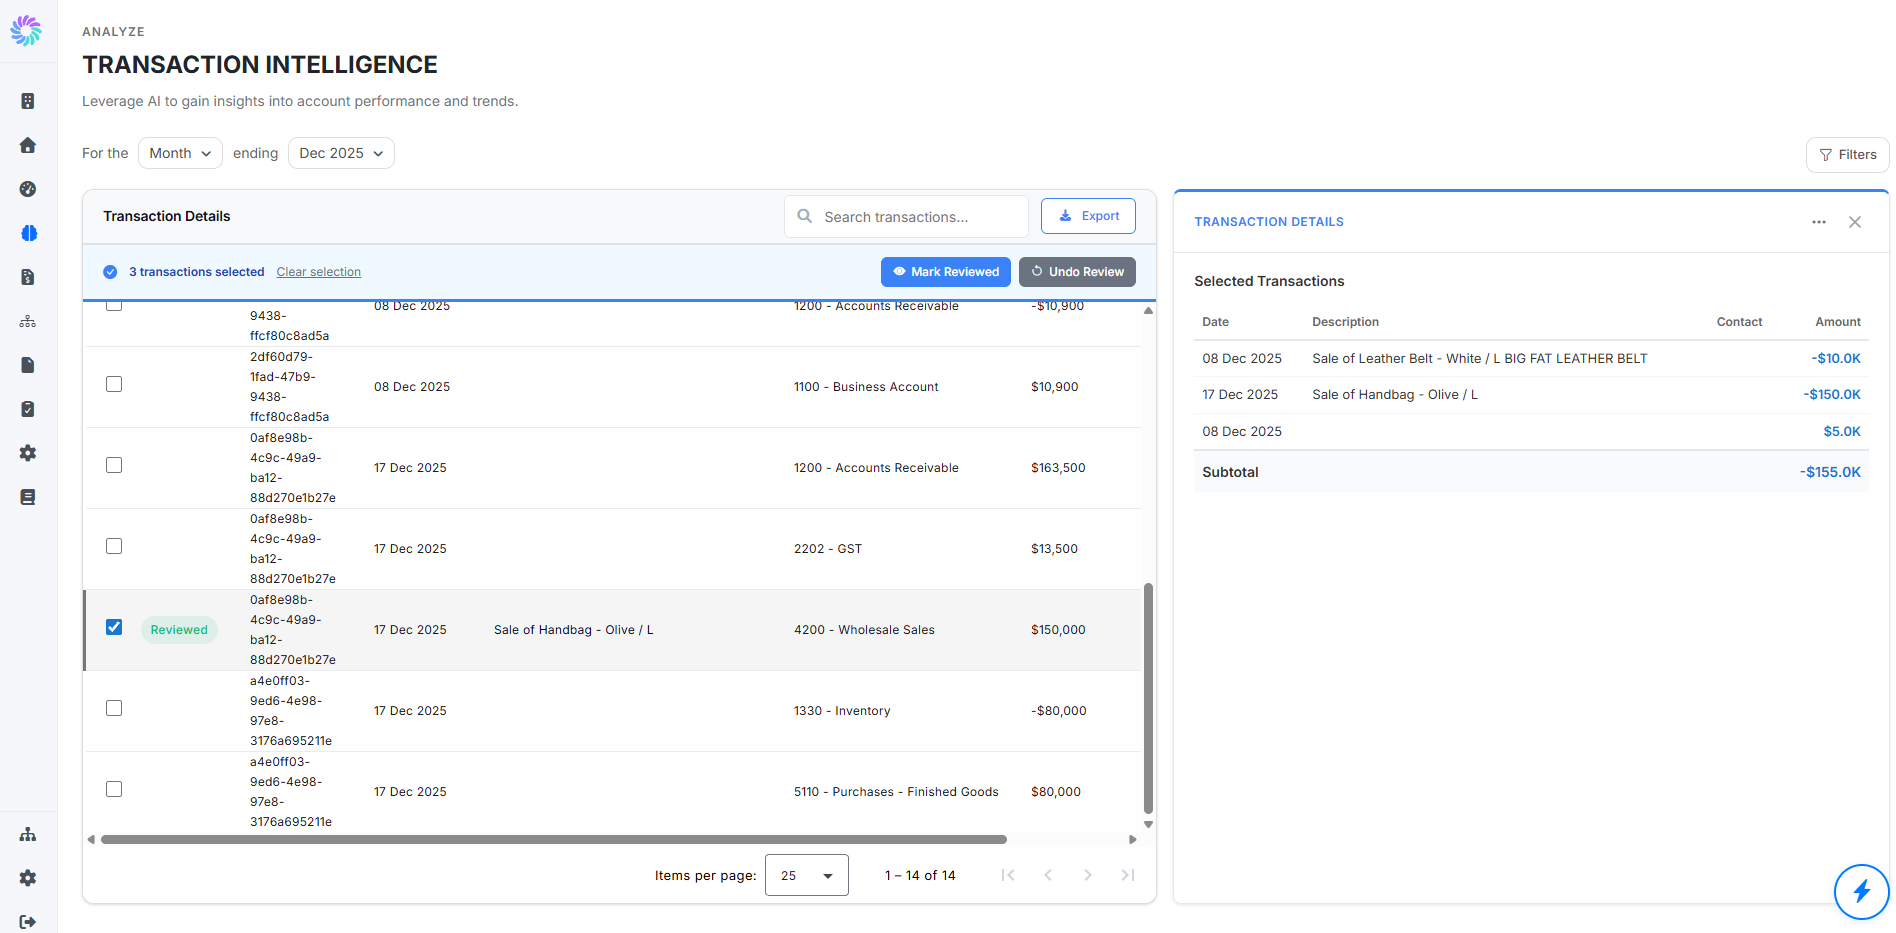
Tick the checkbox at the start of multiple rows to compare them together. The right panel switches to an aggregated view:
- Selected Transactions: the list of selected rows with their dates, descriptions, contacts, and amounts, plus a Subtotal at the bottom
Step 6. Mark Reviewed and Export
Once one or more transactions are checked, two action buttons appear above the table:
- Mark Reviewed: stamps a green Reviewed badge in the Status column for every selected row, so you can track close progress at a glance
- Undo Review: removes the Reviewed badge from selected rows
When you are ready to share the list outside Planir, click Export at the top right of the Transaction Details panel to download the current filtered view as a CSV. Useful for sending a transaction sample to an auditor, sharing close progress with a manager, or pasting into a follow-up email.