Manage Builder
The Model Builder page lets you create custom driver-based models for budgeting and forecasting. Each model is a self-contained set of KPIs, scenarios, dimensions, and period values that you can upload from an Excel template and view in a flexible pivot table. Use it to track operational metrics, build custom planning models, or extend Planir's KPI coverage beyond what your accounting system provides natively.
Why this matters
Some of the most important metrics in your business never make it onto a P&L: headcount, employee turnover, customer satisfaction, units produced, defect rate, conversion rate, and so on. Model Builder gives you a structured place to track them, slice them by dimension and scenario, and bring them alongside your financial data. Because models are uploaded from Excel, you can keep the source-of-truth wherever you already maintain it (an HRIS export, an ops report, a CRM dashboard) and refresh the model whenever the underlying data changes.
When to use this
- When tracking operational KPIs that do not exist in your accounting system (headcount, turnover, conversion, defect rate)
- When building a driver-based budget or forecast model that needs its own scenarios and dimensions
- When a leadership team wants to see operational and financial KPIs side by side
- When refreshing a model with new period data or new KPIs
Before You Start
Make sure you have:
- The Excel template downloaded from the upload wizard (or your data already structured in the same column layout)
- A clear list of the KPIs you want to track and the periods you want to load
- Your categories configured in Setup, Categories if you want the model to slice by Category A, B, C, etc. The Excel column headers you use for dimensions must match the source category labels mapped on that page.
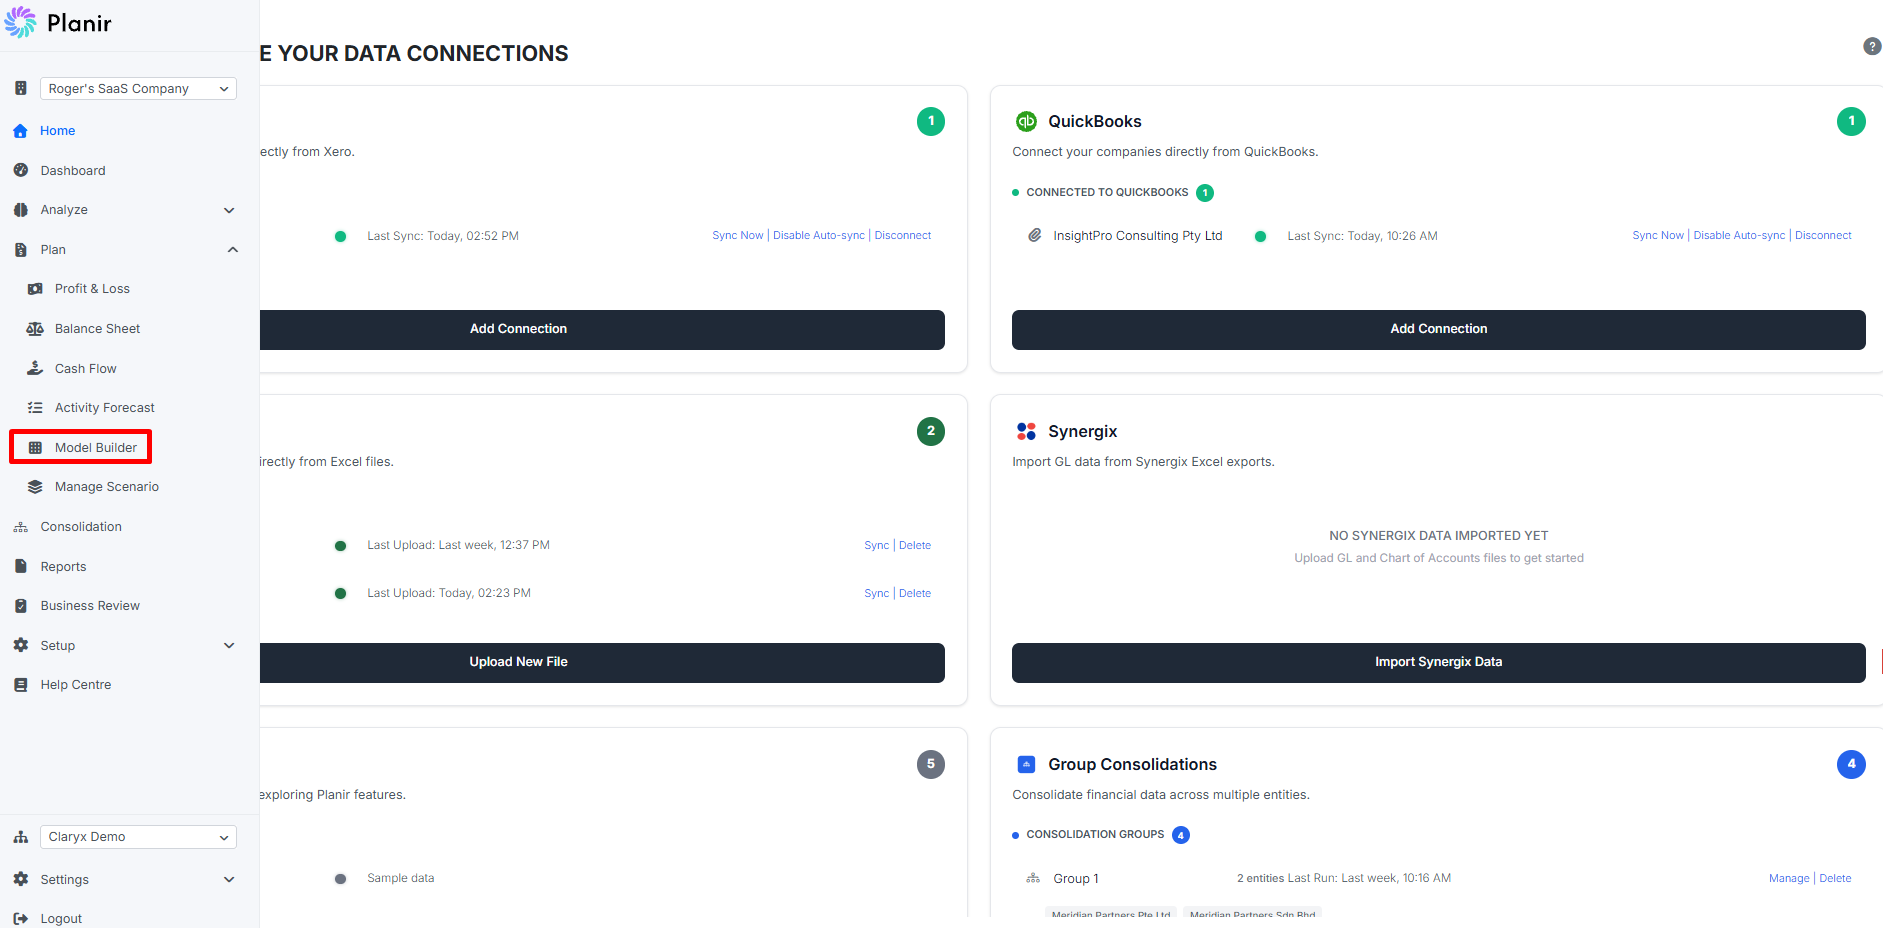
Step 1. Open the Model Builder Page
- From the sidebar, expand Plan.
- Click Model Builder.
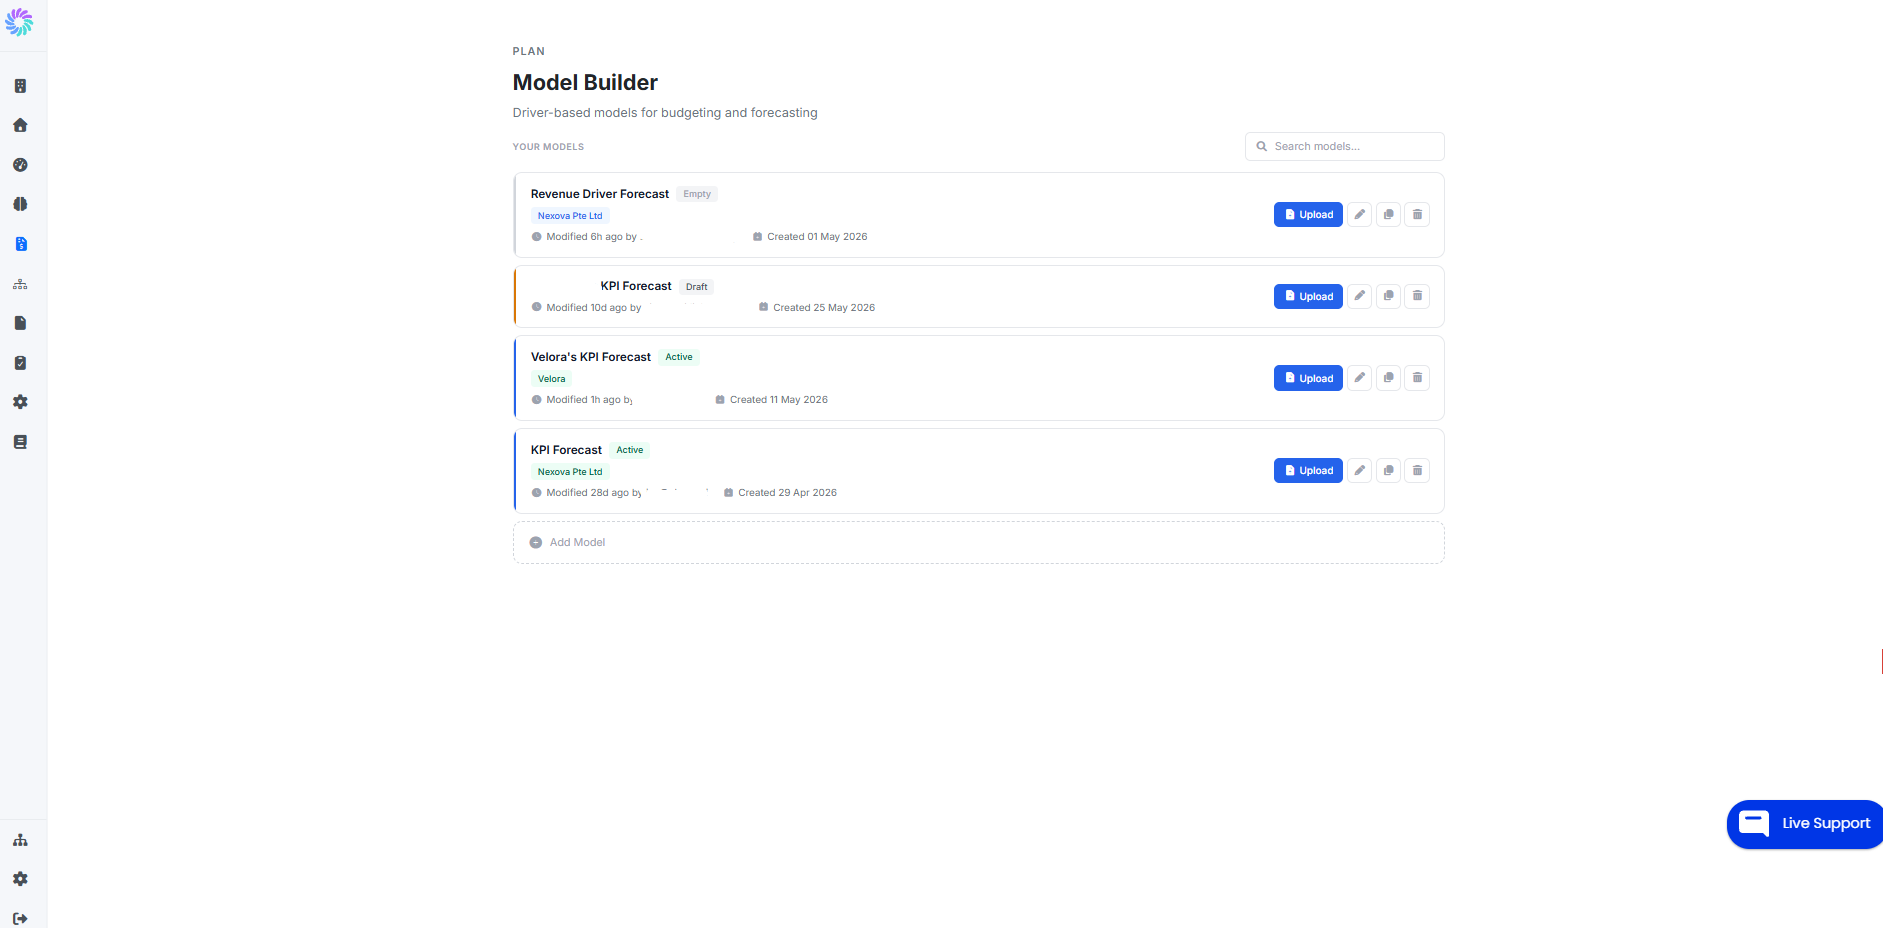
The page opens with a list of every model in your workspace. Each model card shows its name, a status tag (such as Empty or Draft), a description, and metadata (Modified date, Created date).
Use the search bar at the top to filter models by name when you have many.
Step 2. Create a New Model
- Click + Add Model at the bottom of the list.
- Enter a MODEL NAME (for example,
Revenue ForecastorHeadcount Plan). - Add an optional DESCRIPTION (for example, "Driver-based projection of revenue across sales channels").
- Click Create.
The new model appears in the list with an Empty tag, ready to receive data.
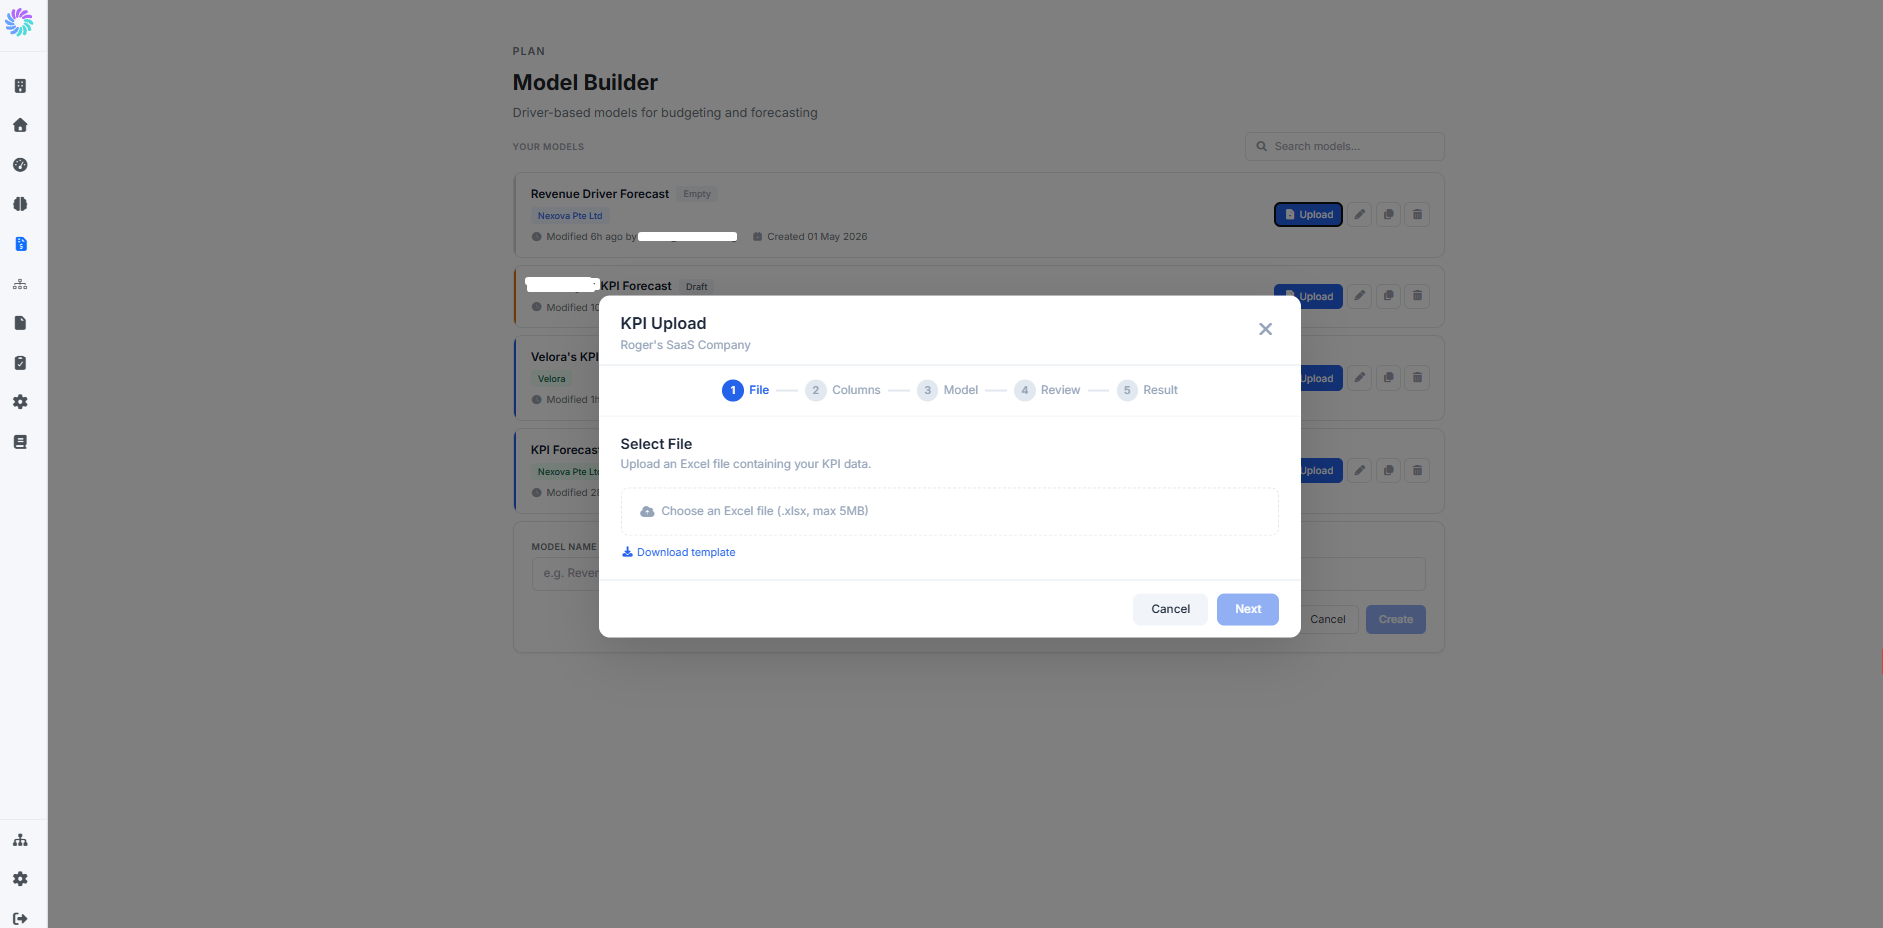
Step 3. Upload Data
To populate a model with KPIs, scenarios, dimensions, and period values, click Upload on the model card. The KPI Upload wizard opens with five stages: File, Columns, Model, Review, Result.
Step 3a. Select Your File
In the first stage, choose your Excel file.
- Click Choose an Excel file and select your
.xlsxfile (maximum 5MB). - If you do not have a file ready, click Download template to grab the Planir-formatted template, fill it in, and re-upload.
Click Next to continue.
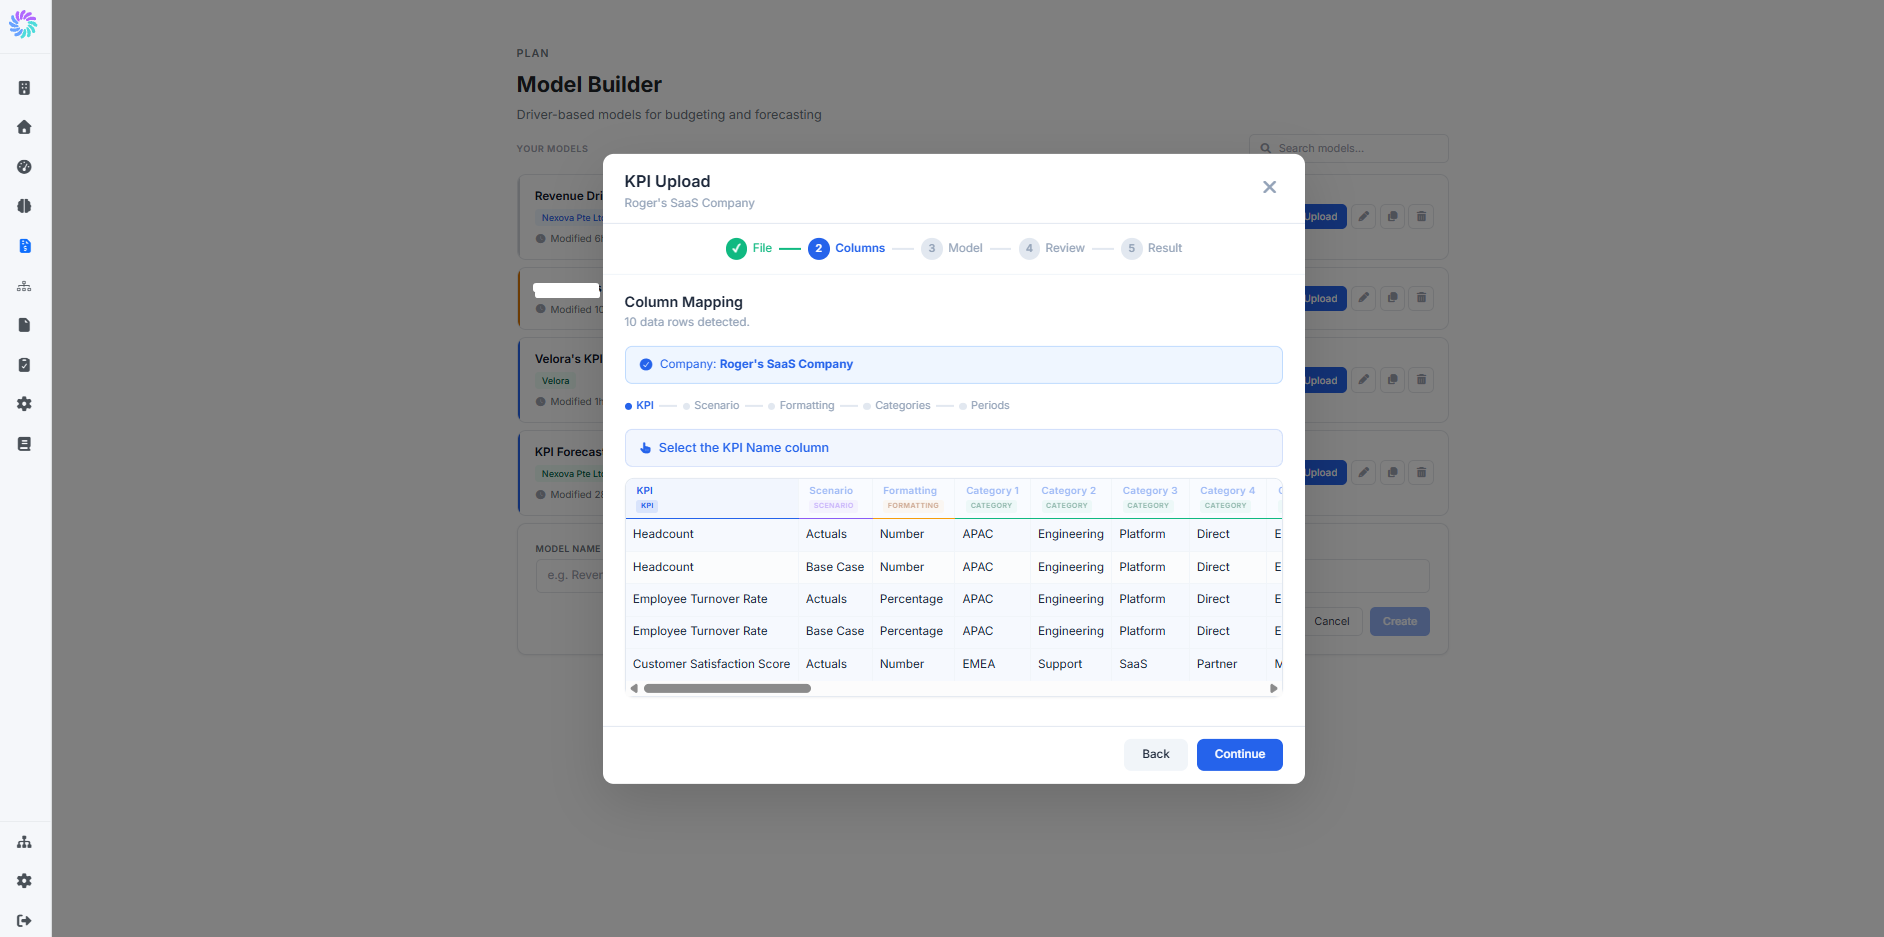
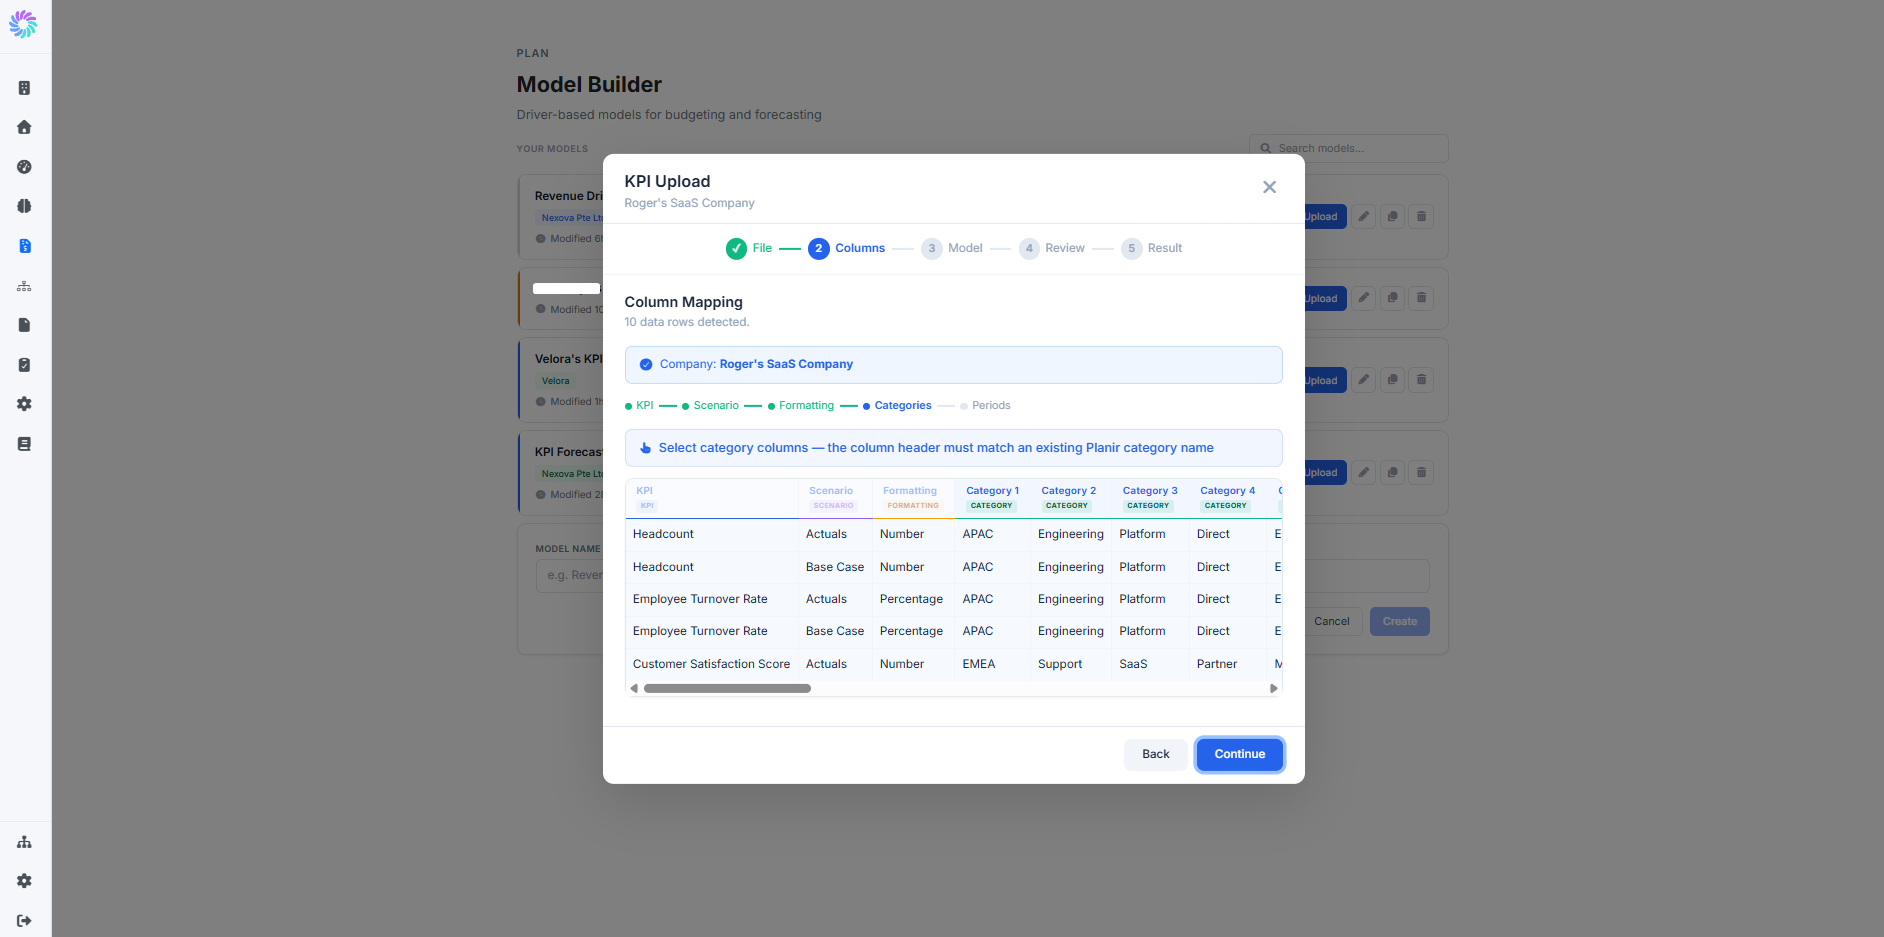
Step 3b. Map the Columns
In the Columns stage, walk through five guided prompts in order: KPI, Scenario, Formatting, Dimensions, Periods. The wizard auto-detects a likely column from your file for each prompt and shows a preview of the data so you can confirm.
- KPI: the column that holds each KPI name (for example, Headcount, Customer Satisfaction Score)
- Scenario: the column that identifies which scenario each row belongs to (for example, Actuals, Base Case)
- Formatting: the column that says how the KPI should be displayed (for example, Number, Percentage)
- Dimensions: the columns that hold each category value. The column header in your Excel file must match a source category label mapped on the Setup, Categories page (for example, "Department", "Region", "Channel"). If a header does not match, that column will not be recognized as a dimension and will be skipped.
- Periods: the columns that hold the period values (for example, May-2025, Jun-2025, Jul-2025). The wizard detects all period columns automatically and shows them in a checklist so you can include or exclude individual periods.
Click Continue between prompts and Next at the end of the stage.
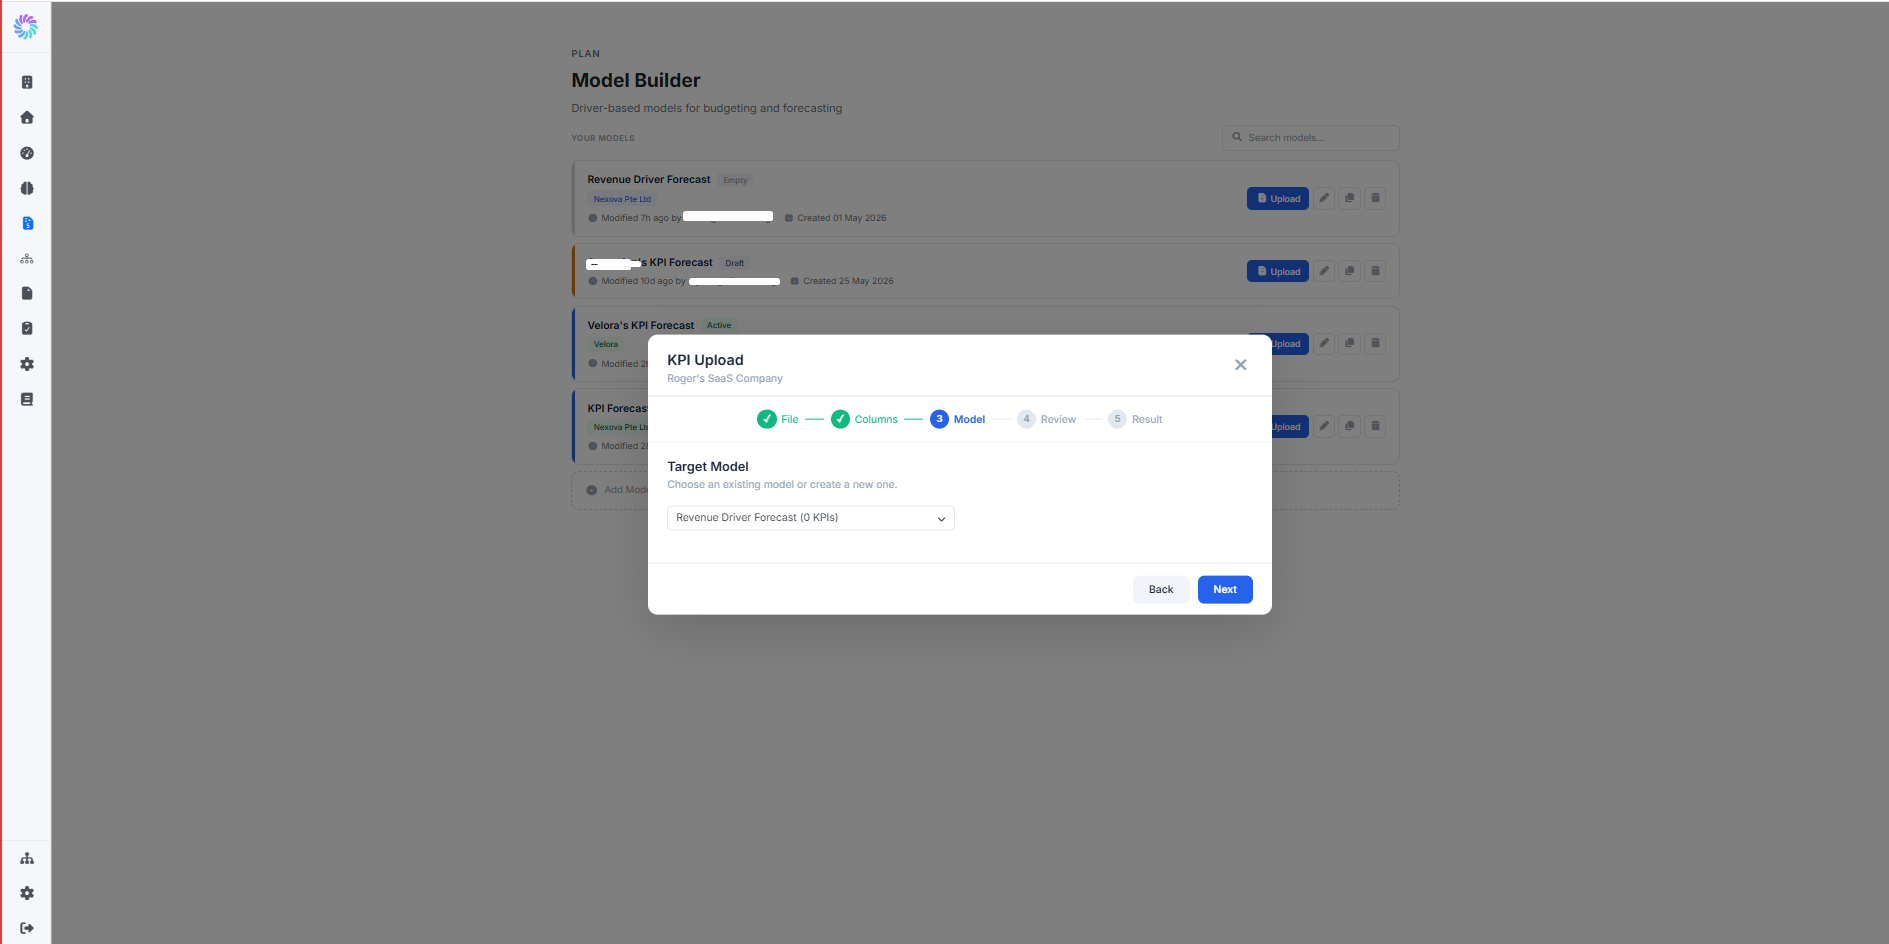
Step 3c. Choose the Target Model
In the Model stage, decide whether to write the data into an existing model or create a new one.
- Use the Target Model dropdown to pick an existing model, or select + Create New Model.
- If creating a new model, enter the model name in the field that appears.
- Click Next.
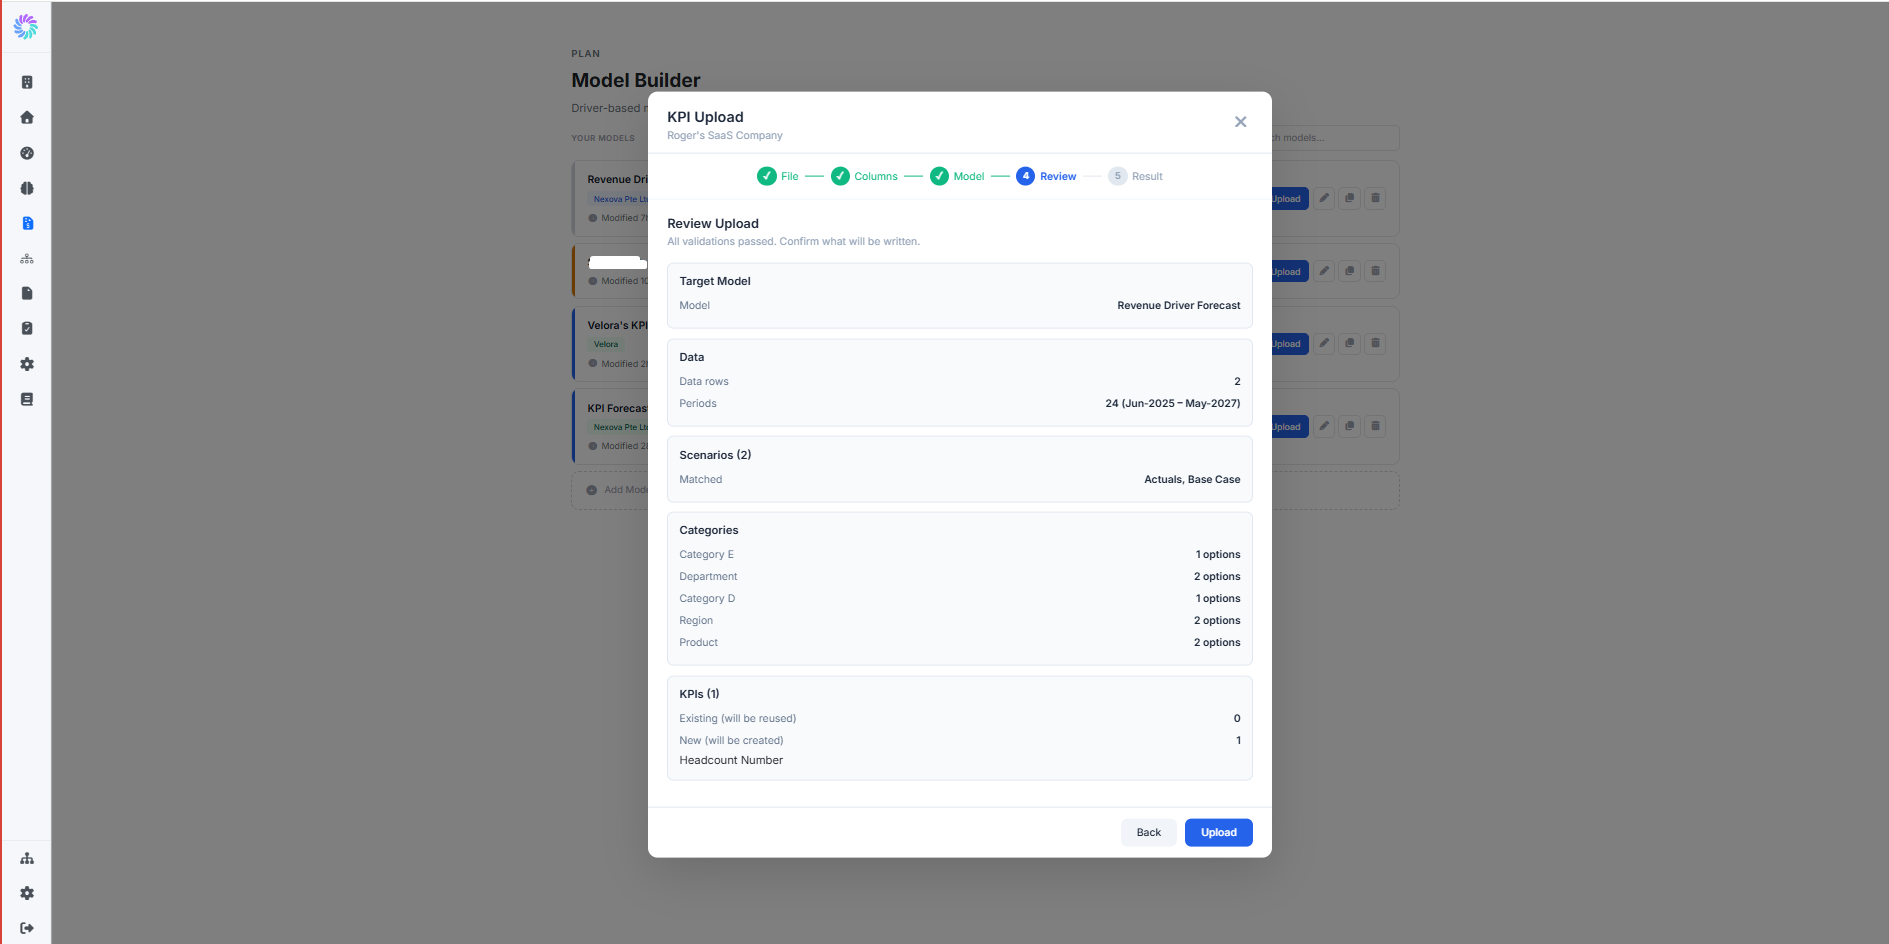
Step 3d. Review and Upload
The Review stage shows a summary of everything that will be written: the target model, the number of data rows, the period range, the scenarios matched, the dimensions detected, and the KPIs that will be created.
If anything looks wrong, click Back to fix it. If everything checks out, click Upload.
The Result stage confirms a successful upload, and the model card on the Model Builder page updates to show a Draft tag (or an updated modified date if you wrote into an existing model).
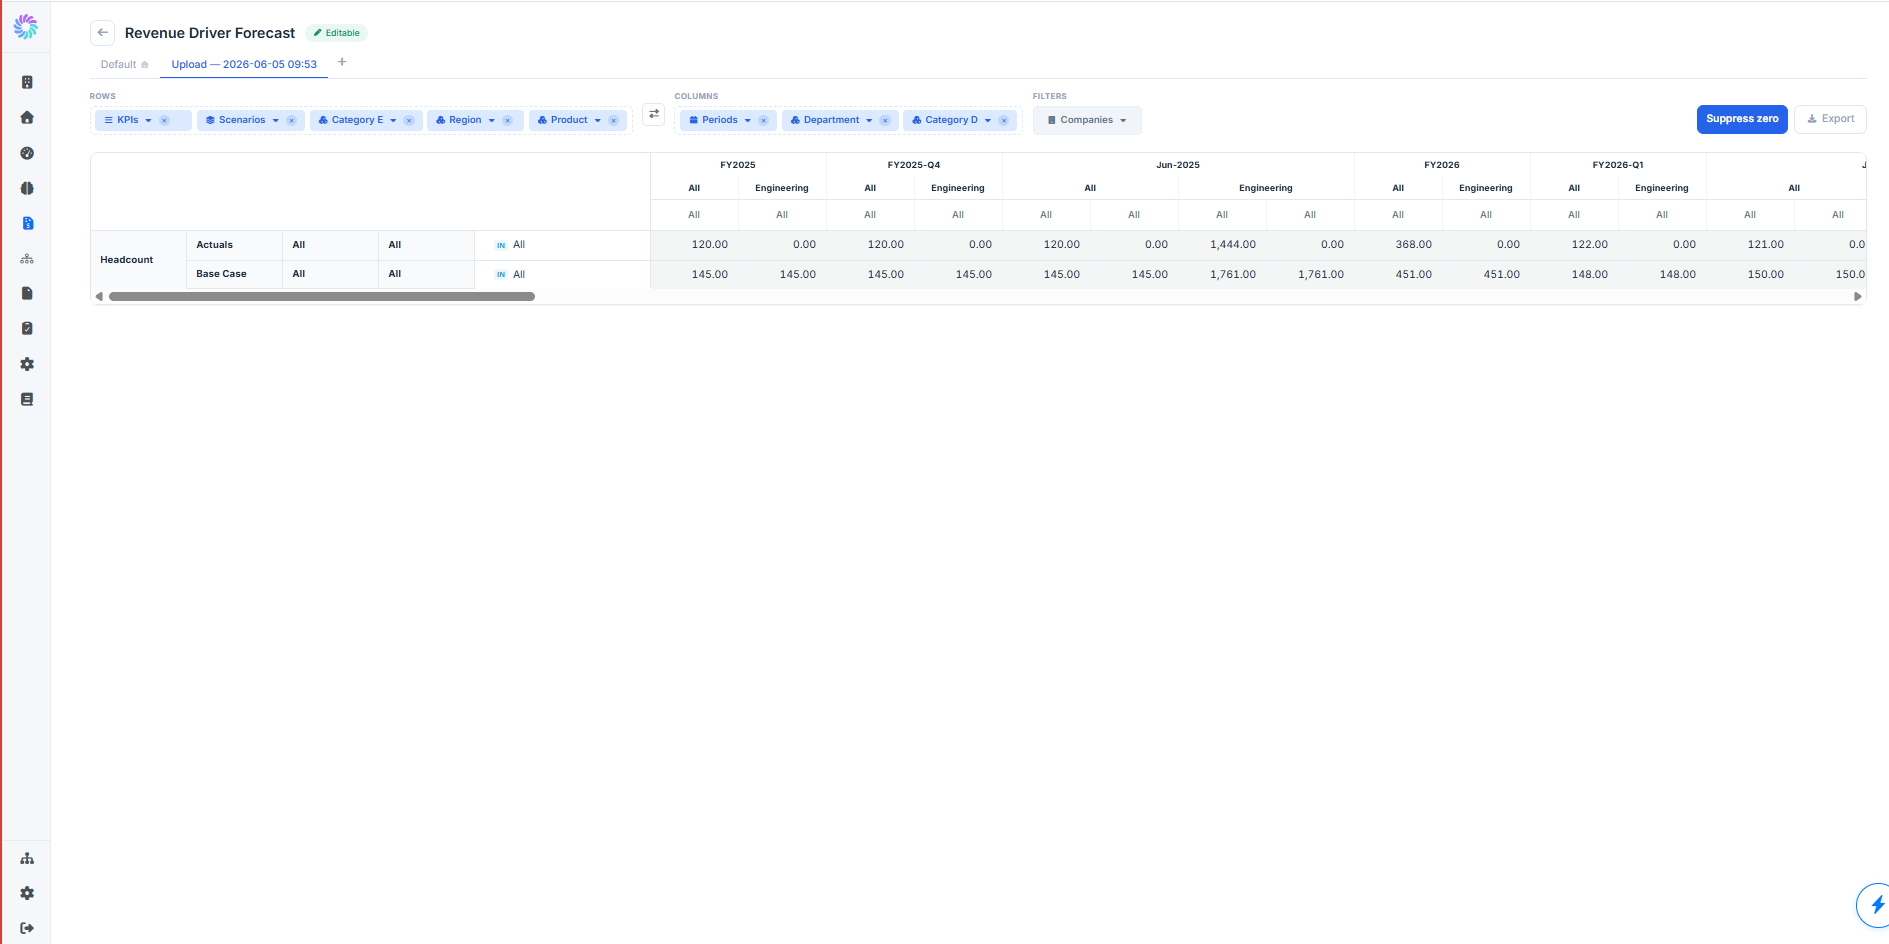
Step 4. View Your Model
Click the model card from the Model Builder page to open the model in its pivot table view.
The model viewer is organized into three configurable areas:
- ROWS: drag pills to choose what appears as rows. Defaults to KPIs and Scenarios, with optional dimensions (Category A, B, C, D, E).
- COLUMNS: choose what appears as columns. Defaults to Periods.
- FILTERS: narrow the view by Companies or other top-level filters.
Two toggles at the top right let you control the view:
- Suppress zero: hides rows or columns where every value is zero, useful for cleaning up sparse data
- Export: downloads the current view as a CSV file
The model is Editable (badge at the top of the page), so values can be edited directly in the table and saved back.
Step 5. Manage Your Models
From the Model Builder page, each model card has four action icons on the right:
- Upload: open the KPI Upload wizard to add more data to the model
- Edit (pencil icon): rename the model or change its description
- Duplicate (copy icon): create a copy of the model with all its data, useful for stress-testing a variant
- Delete (trash icon): remove the model and all its data from the workspace