Get Started with Planning
The Plan section is where you read your financial statements, edit your forecast assumptions, and build the models and scenarios that drive your projections. Six tools sit under Plan three for reading (Profit & Loss, Balance Sheet, Cash Flow) and three for planning (Activity Forecast, Model Builder, Manage Scenario). This article introduces each one so you know which to reach for and where to go next.
Why this matters
Every report, dashboard, and AI insight in Planir is built on the values that flow through the Plan section. Knowing what each tool does and how they relate is the fastest way to navigate your way around your numbers.
When to use this
- During your monthly close to read your latest financial statements
- When forecasting future periods or stress-testing scenarios
- When investigating why a line item moved between periods
- When building a custom budget or driver-based model
Before You Start
Make sure you have:
- A connected data source so your accounts and transactions are loaded
- Your Chart of Accounts reviewed in Setup → Chart of Accounts
- Your scenarios configured (the Base Case scenario is created for you by default)
Step 1. Open the Plan Section
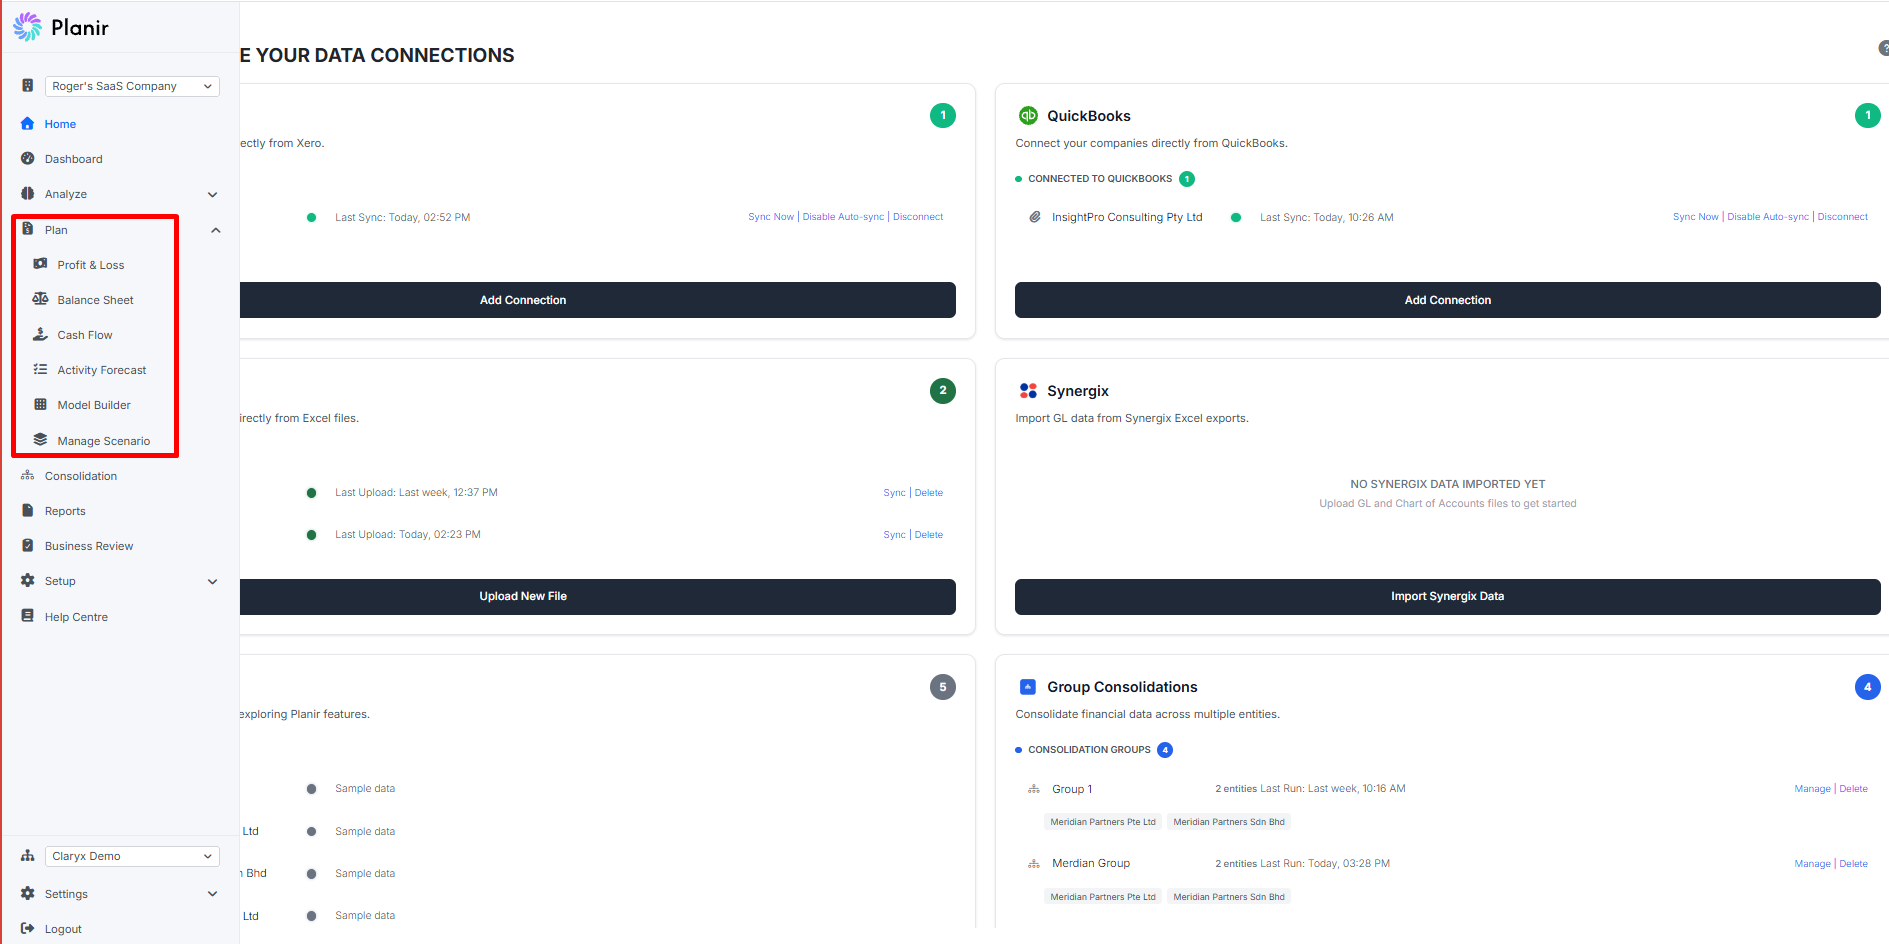
From the sidebar, expand Plan. You'll see six items:
- Profit & Loss
- Balance Sheet
- Cash Flow
- Activity Forecast
- Model Builder
- Manage Scenario
The first three are your financial statements. The last three are your planning tools. The rest of this article walks through each.
Step 2. The Three Financial Statements
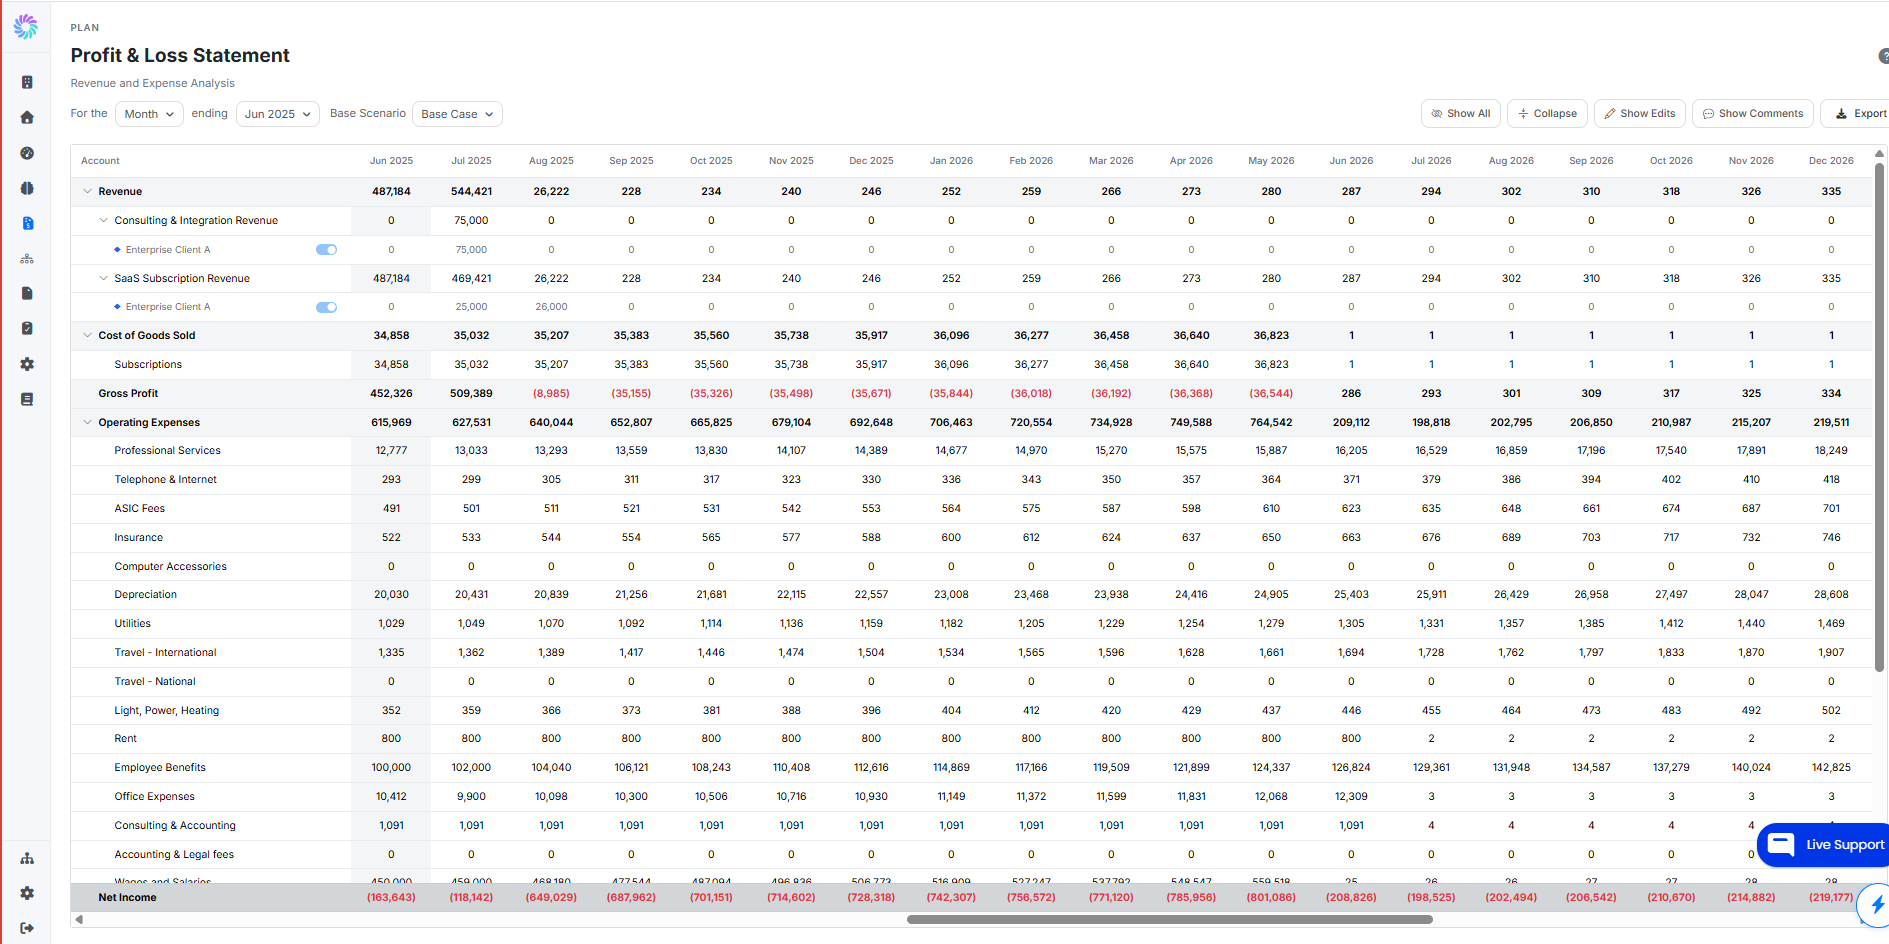
Open any of the three statements to see your data laid out by period across a single, scrollable table. Each statement shares the same layout and behavior:
- Profit & Loss — revenue, costs, and profitability over each period
- Balance Sheet — assets, liabilities, and equity at each period-end
- Cash Flow — operating, investing, and financing cash movements
Accounts are grouped under their parent categories (Revenue, Cost of Goods Sold, Operating Expenses, etc.), with bold roll-up rows like Gross Profit and Net Income calculated automatically. Future periods appear alongside historical periods so you can read actuals and forecast in the same view.
Step 3. Common Controls
Every statement uses the same controls at the top:
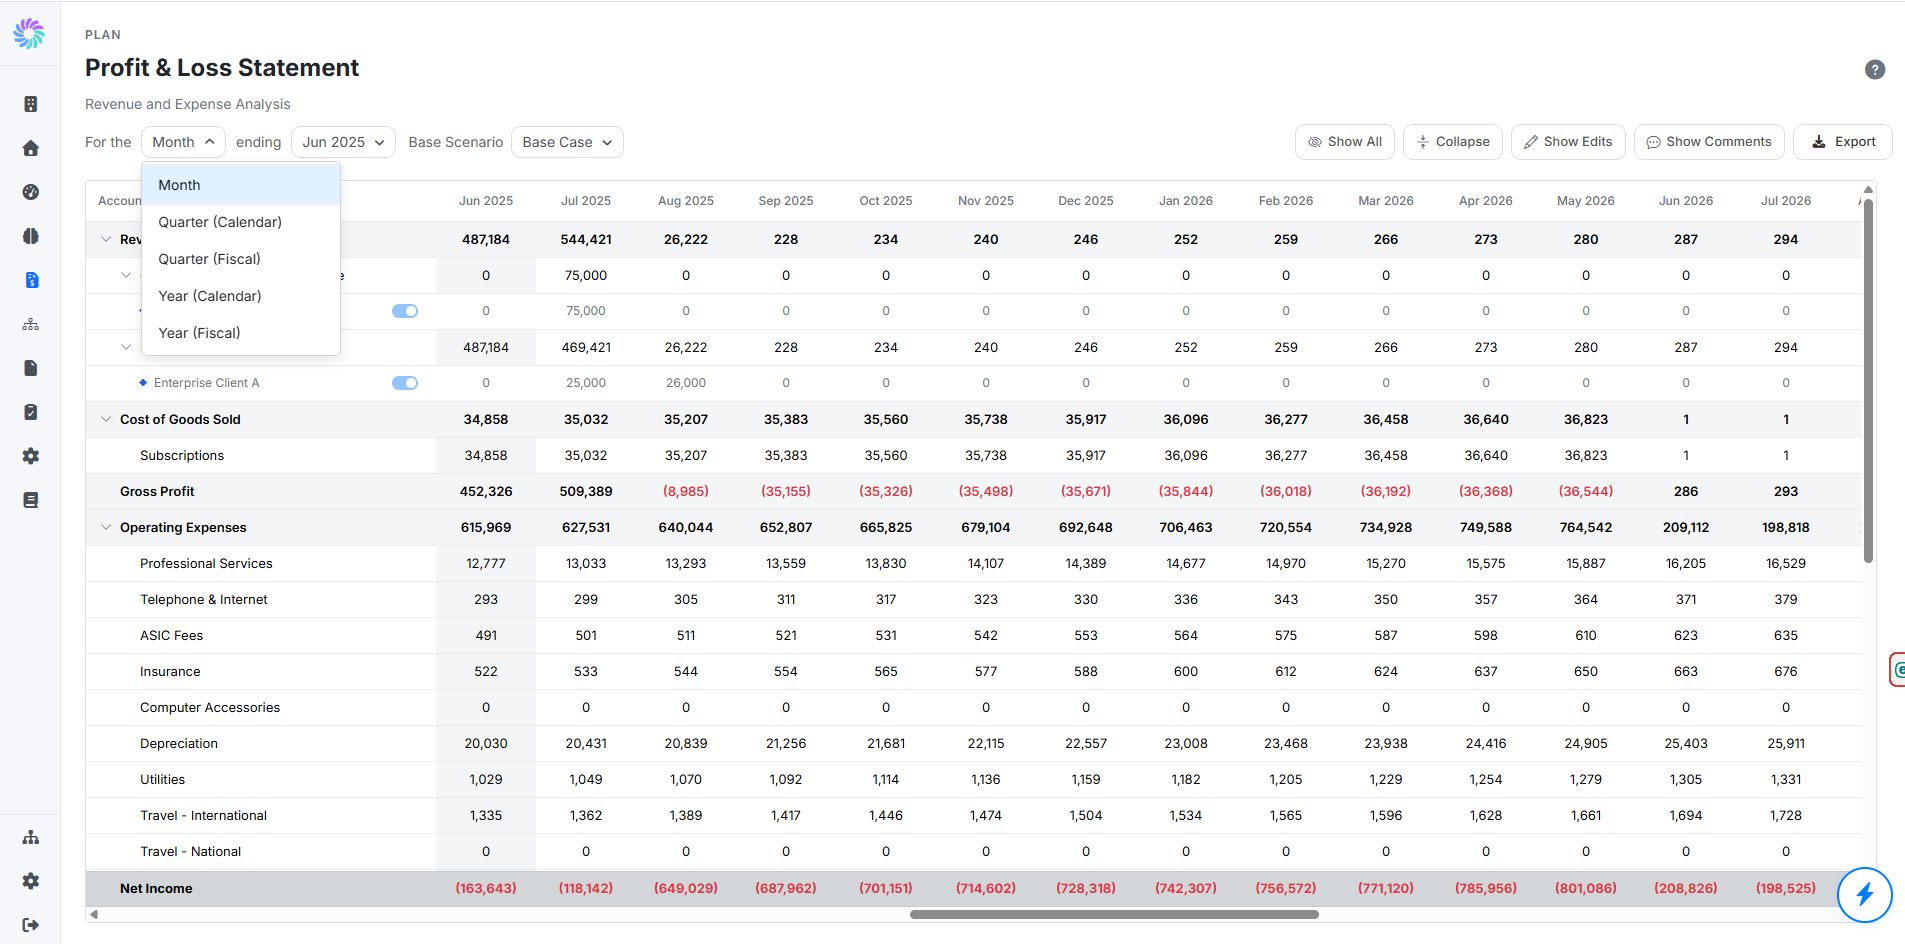
- For the [Period type] ending [Date] — switch between Month, Quarter (Calendar), Quarter (Fiscal), Year (Calendar), and Year (Fiscal); pick any end date
- Base Scenario — choose which scenario the values reflect (e.g., Base Case)
- Show All / Collapse All — expand or collapse every group at once
- Show Edits — highlight cells where forecast values have been manually edited
- Show Comments — surface any comments left on cells
- Export CSV — download the statement
Step 4. Drill Into a Line Item
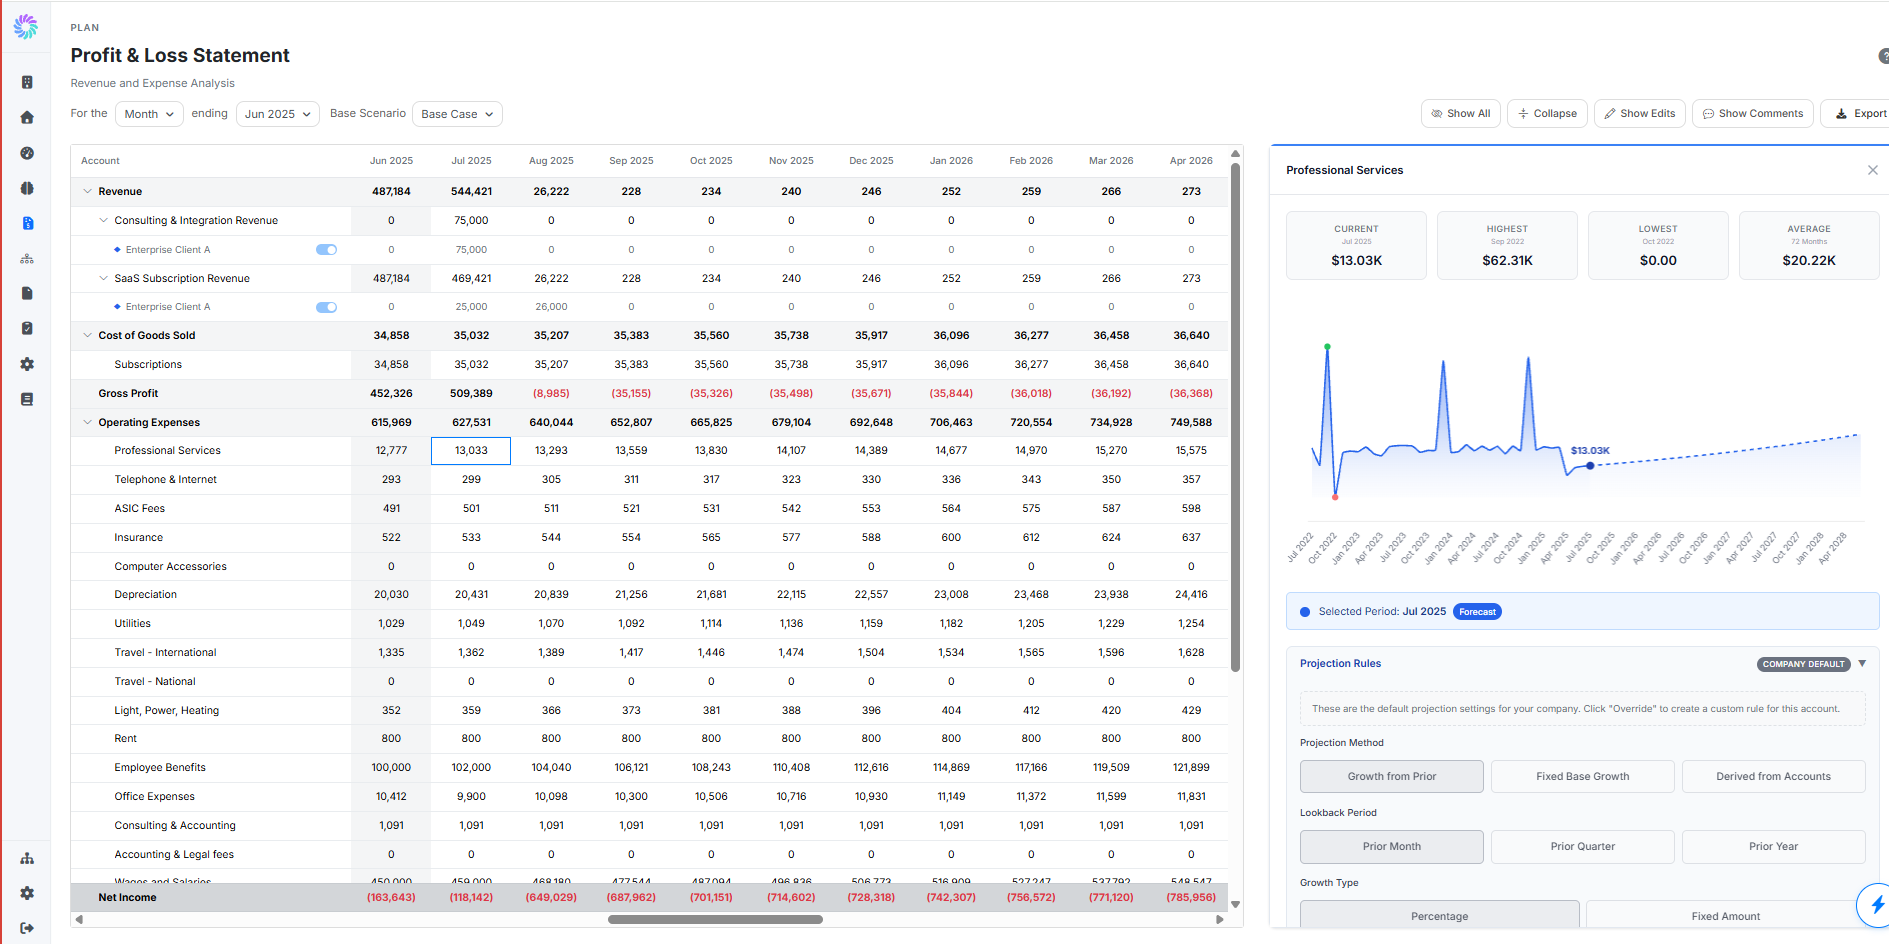
Click any cell to open a detail panel on the right with Current, Highest, Lowest, and Average values, plus a trend chart showing the line item over time. A Selected Period badge tells you whether the cell you clicked is Actual or Forecast.
For forecast cells, the same panel also lets you edit projection rules and (on the Balance Sheet) create manual journals. Those features are covered in detail in the dedicated articles for Forecasting Profit & Loss, Forecasting Balance Sheet, and Forecasting Cash Flow.
Step 5. The Three Planning Tools
The last three items under Plan are where you set up the forecasting logic that drives the financial statements above.
Activity Forecast
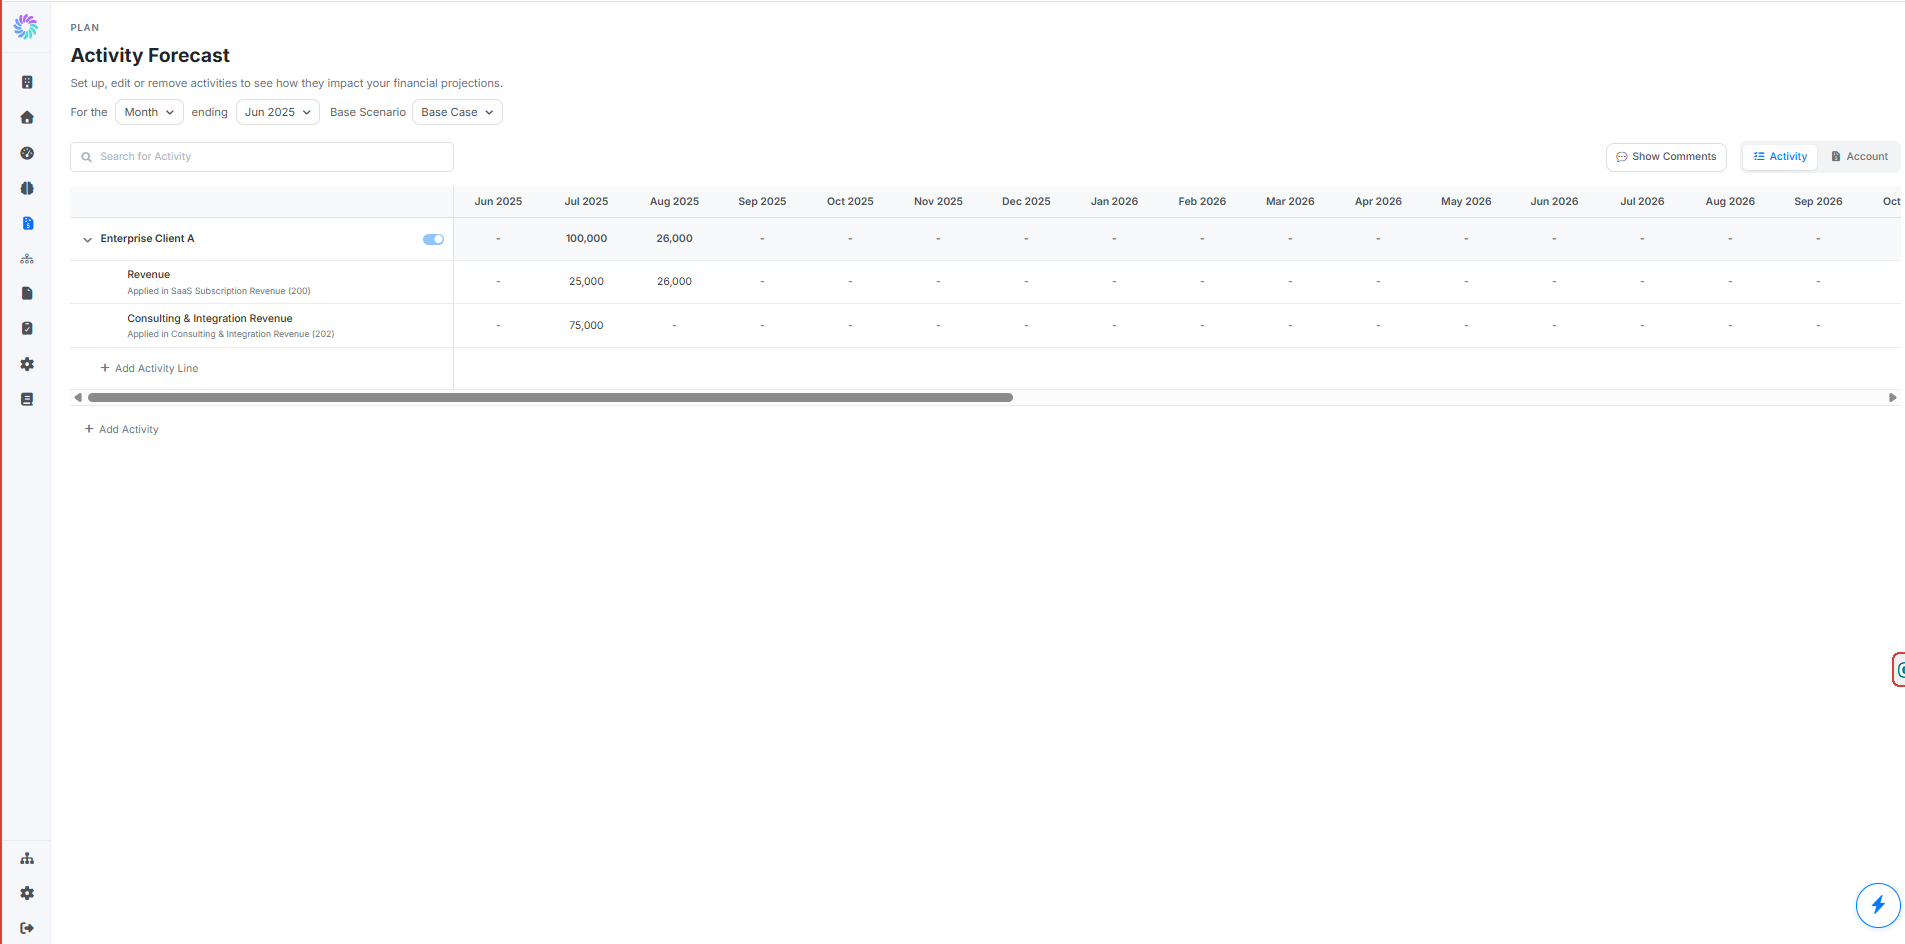
Set up activities like new hires, marketing campaigns, or new customer wins to see how they impact your financial projections. Each activity can be timed independently and can flow into either expense or revenue accounts. Some run for a fixed window (e.g., a quarterly campaign), others kick in from a chosen month and continue onwards (e.g., a new hire or a new wholesale customer).Activity Forecast
Set up activities like new hires, a product launch, or a marketing campaign to see how they impact your financial projections. Activities are typically viewed by quarter across multiple fiscal years, so you can plan and review impact at the level your business actually operates on.
Model Builder
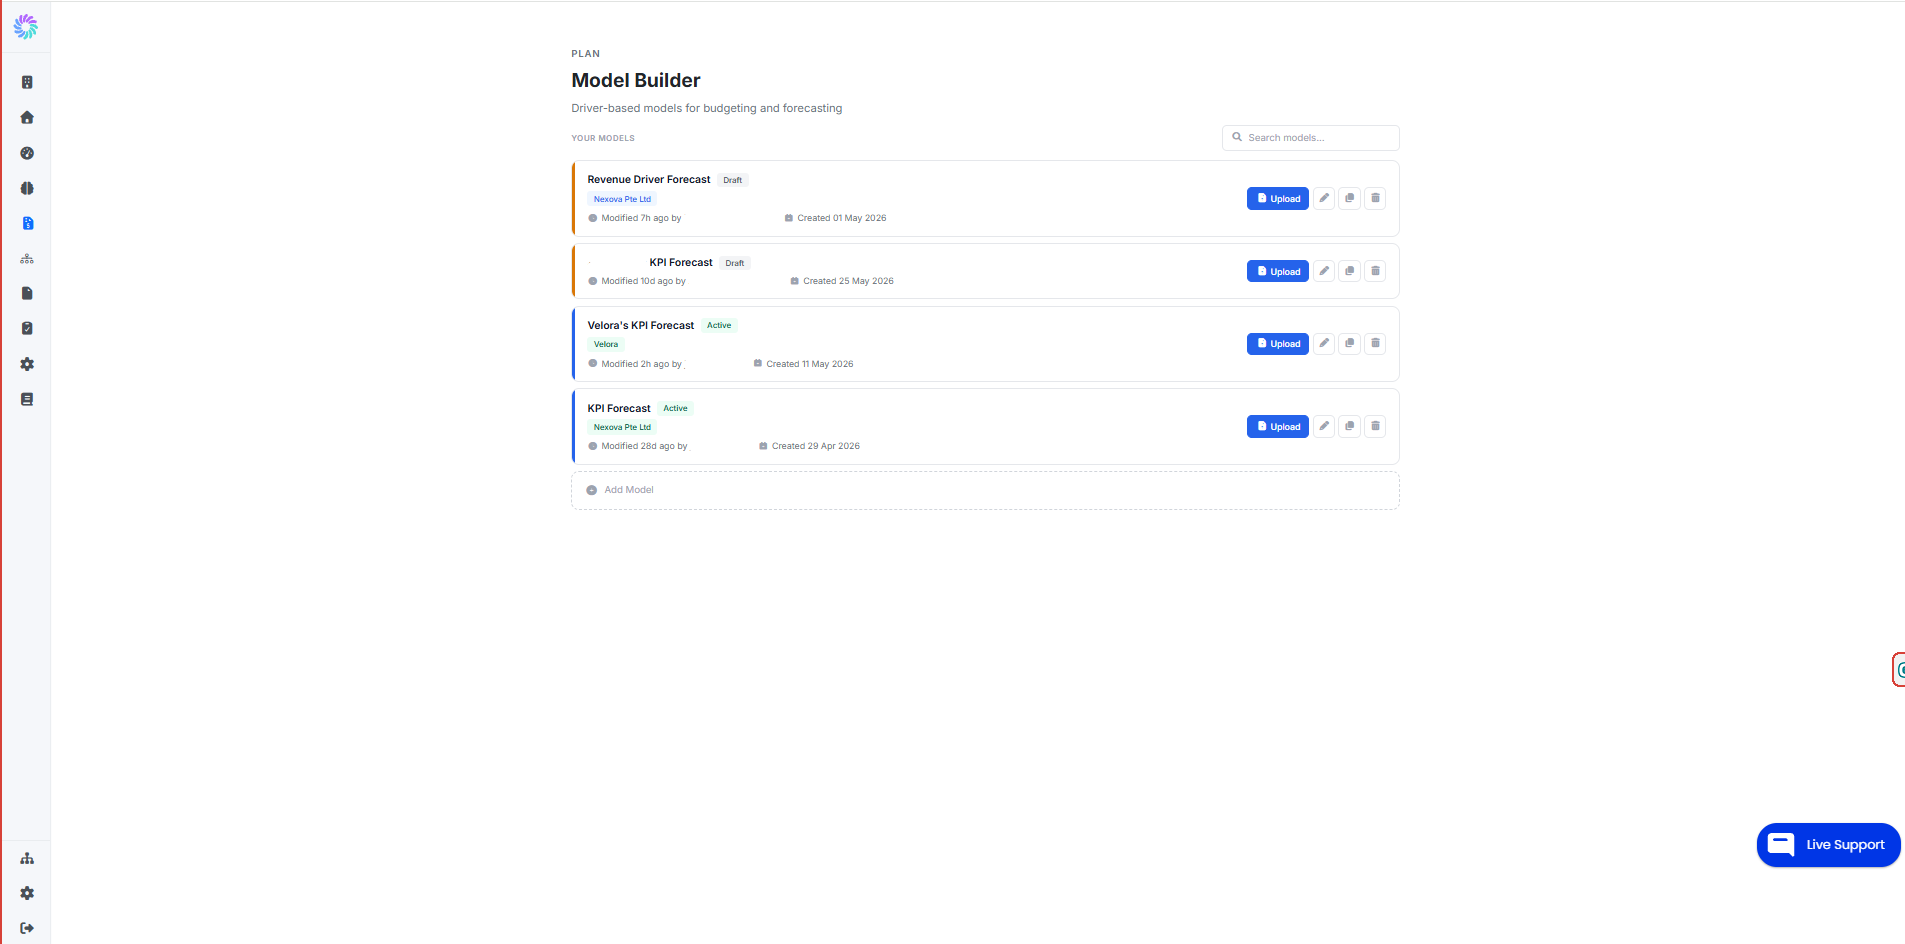
Build custom driver-based models for budgeting and forecasting. Each model is a self-contained set of inputs and logic you can reuse across scenarios for example, a Revenue Forecast model driven by units, price, and conversion assumptions.
Manage Scenario
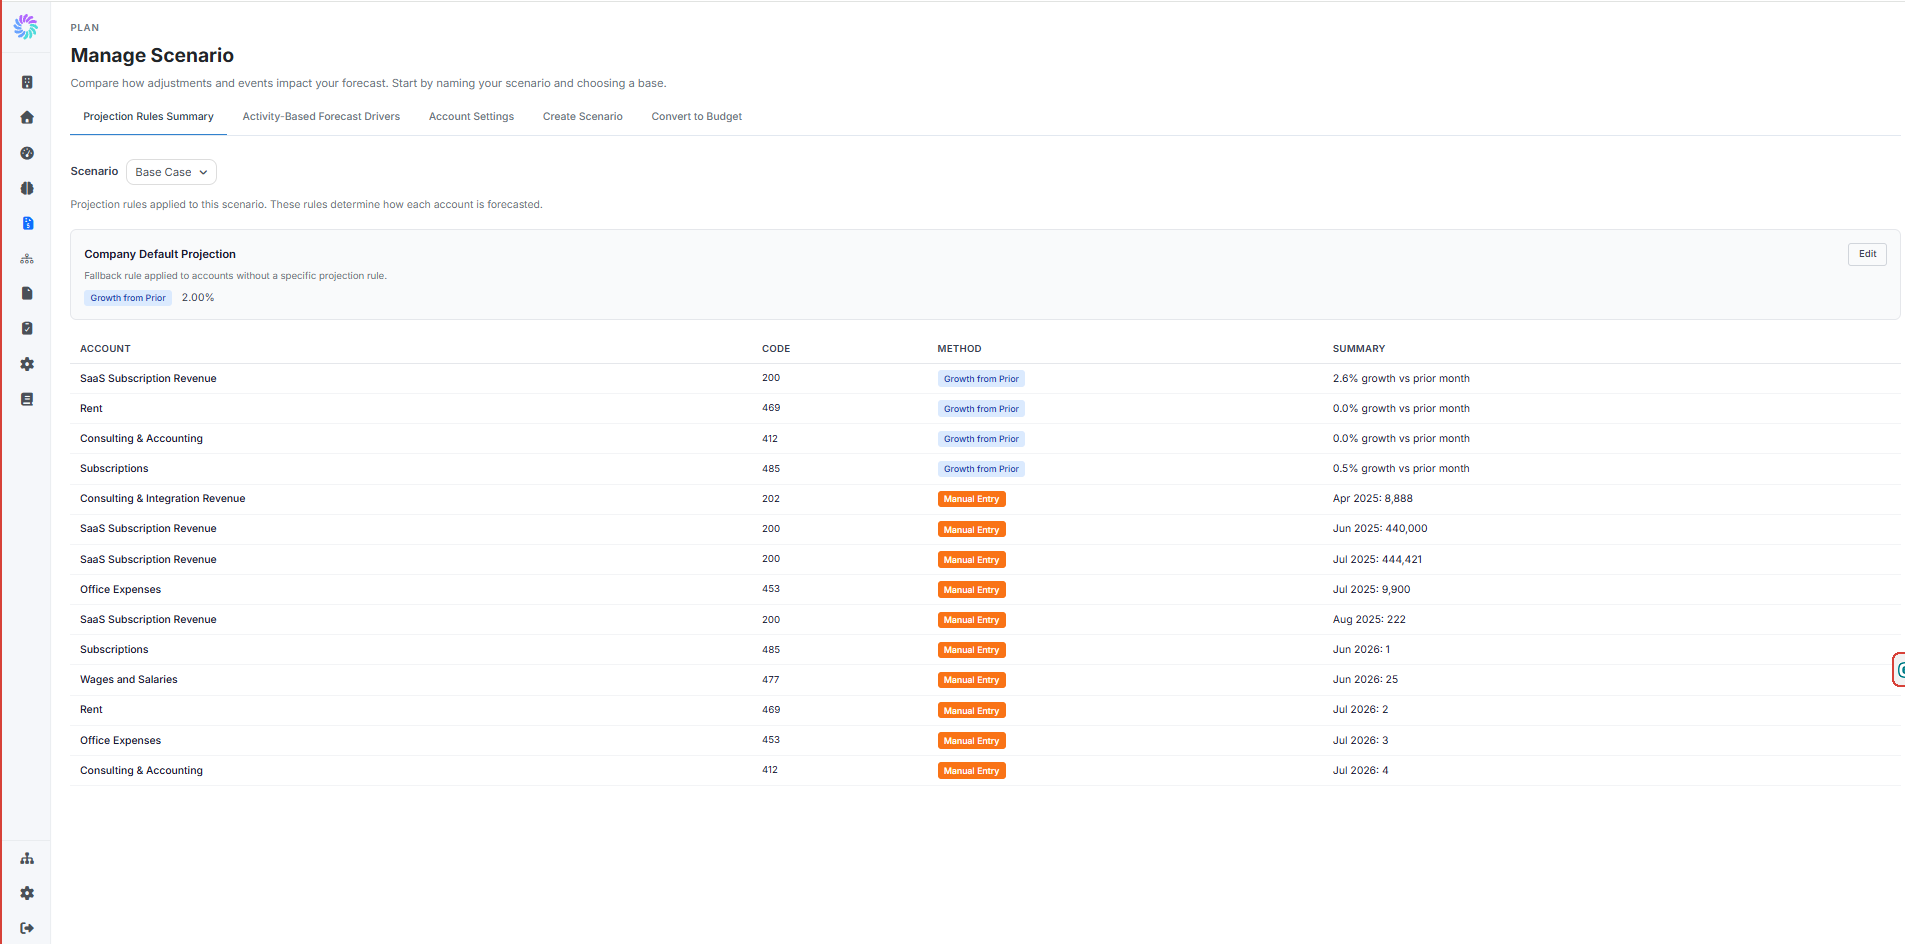
Configure how each scenario forecasts. Manage Scenario has five tabs:
- Projection Rules Summary — view the company default projection and any per-account overrides
- Activity-Based Forecast Drivers — link activities to the accounts they affect
- Account Settings — configure AR/AP ageing, default Balance Sheet accounts, and the Balance Sheet account each P&L line posts to (pre-payments, accrued, cash)
- Create Scenario — create a new forecast scenario, optionally based on an existing one
- Convert to Budget — snap a fixed budget from a forecast scenario at a chosen reference period