Get Started with Analysis Tools
Explore Planir's Intelligence Suite a set of AI-powered analysis tools that read your financial data and surface what matters most: risks, opportunities, biggest changes, and root-cause explanations. Use them as your starting point any time you want to understand the story behind your numbers without building a report from scratch.
Why this matters
Reports tell you what happened. The Intelligence Suite tells you why it happened, what's worth your attention, and what to do next. Each tool reads from the same Chart of Accounts, Metrics, and Dimensions you've already configured so you don't have to set anything new up to start using them.
When to use this
- During monthly or quarterly reviews to quickly identify what changed
- When you want a one-screen summary of business health without opening multiple reports
- When a number looks off and you need a fast root-cause read
- When preparing a board update or executive briefing and need ready-to-share commentary
Before You Start
Make sure you have:
- A connected data source so your accounts and transactions are loaded
- Your Chart of Accounts reviewed (so insights are grounded in the right classifications)
- Your KPIs configured in Setup → Metrics with targets and thresholds
- Your industry set in Setup → Company Profile (so AI commentary is industry-aware)
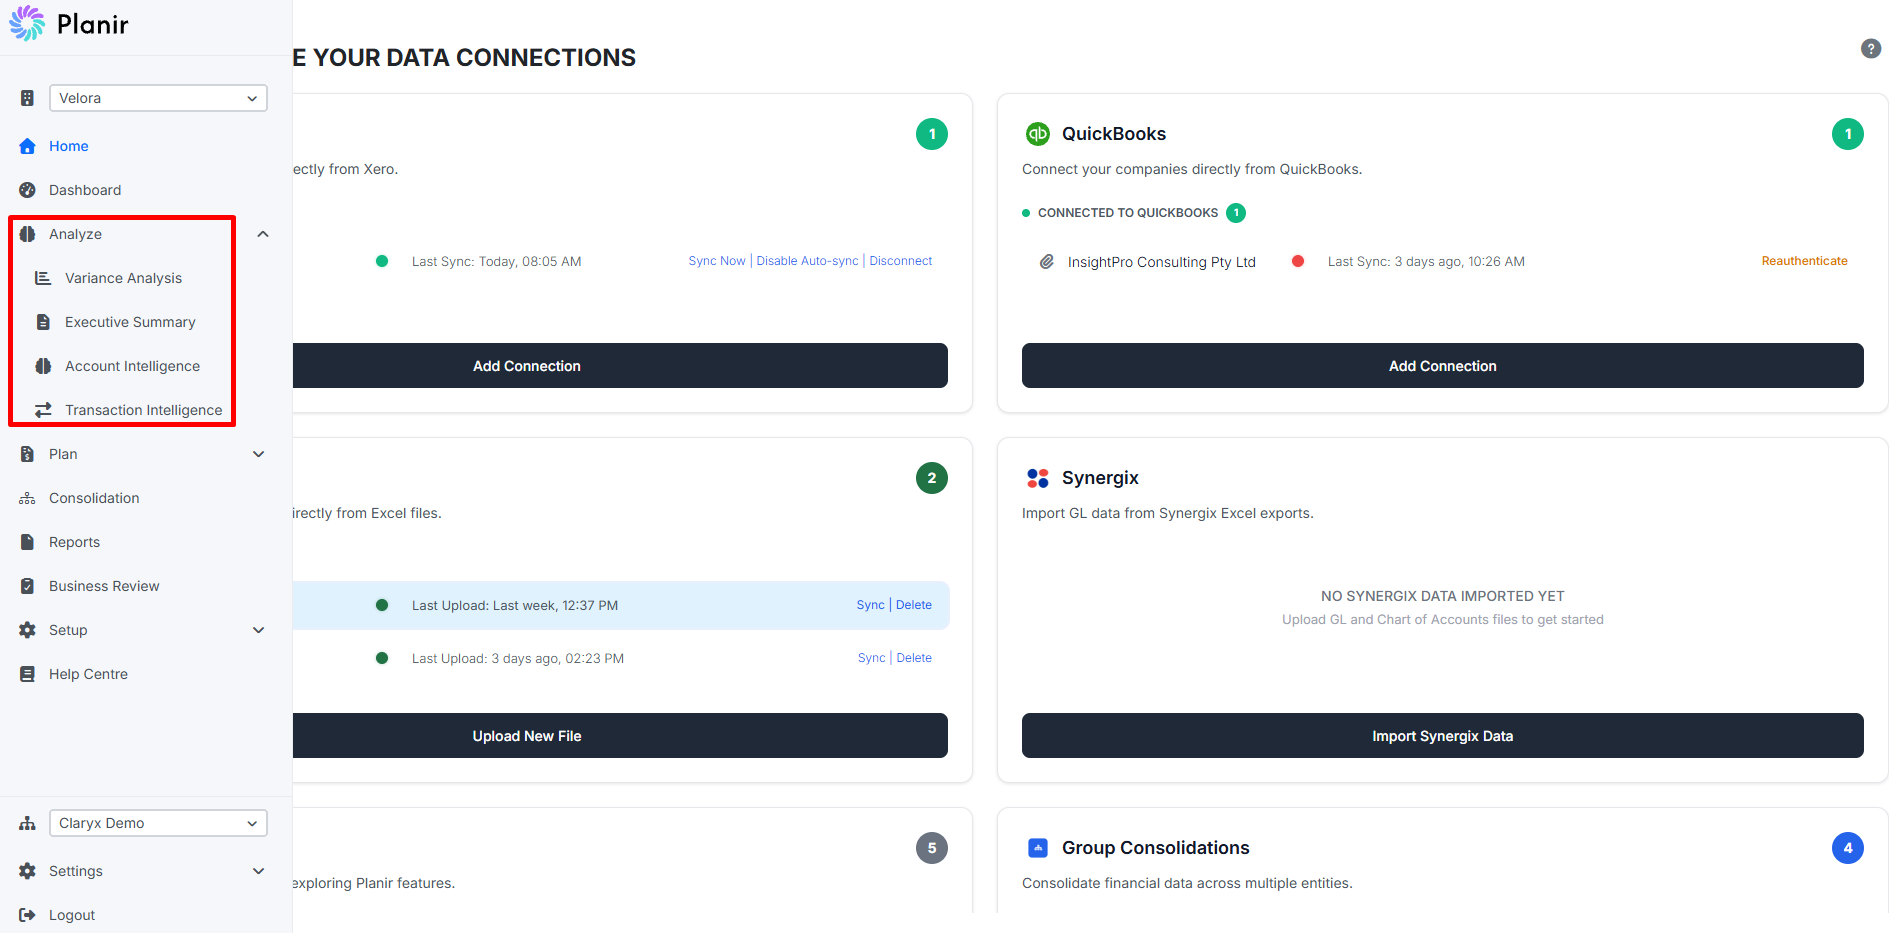
Step 1. Find the Intelligence Suite
- From the sidebar, expand Intelligence.
- Choose the tool that fits your task:
- Executive Summary — your one-screen briefing on overall financial health
- Account Intelligence — drill into a specific account or group of accounts
- Transaction Intelligence — surface unusual or noteworthy individual transactions
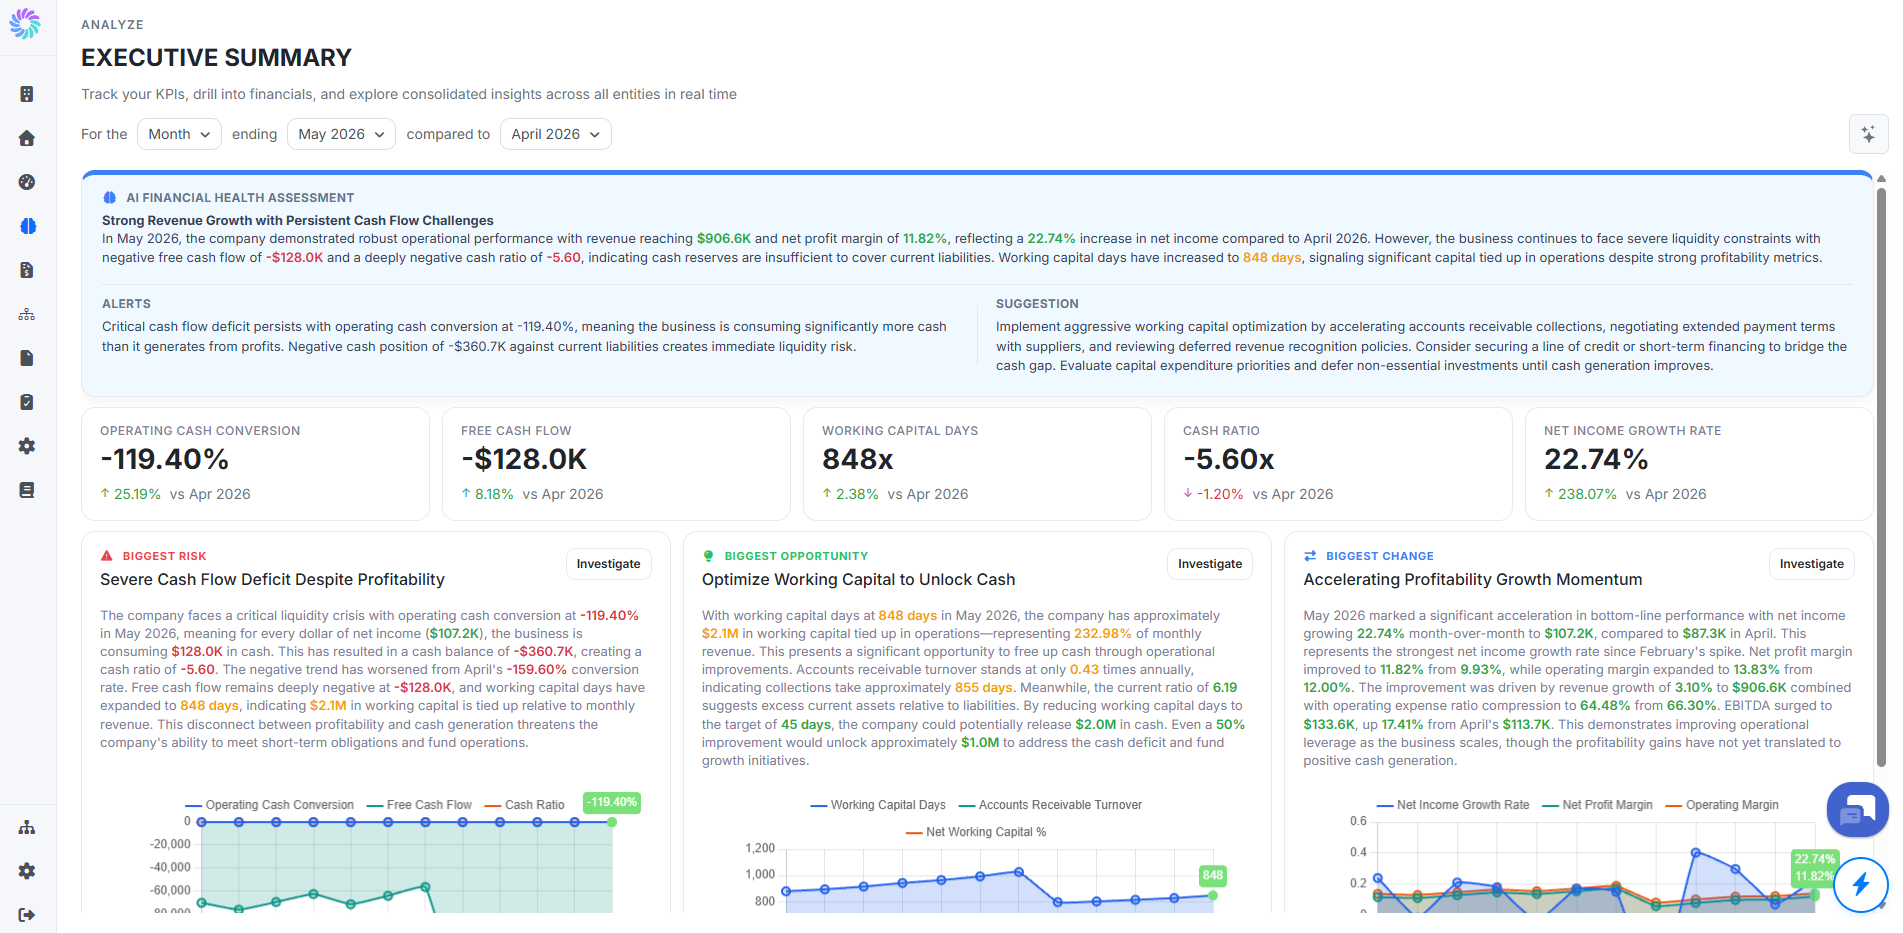
Step 2. Executive Summary — Your AI-Generated Briefing
The Executive Summary is the highest-level view in the Intelligence Suite. Open it any time you want a single page that tells you how the business is doing right now.
What you'll see:
- An AI Financial Health Assessment at the top — a plain-language summary of your performance, with the key numbers highlighted inline (revenue, growth rates, margins, liquidity, cash flow)
- An Alerts section calling out anything that warrants attention (e.g., working capital days trending the wrong way)
- A Suggestion section with concrete next steps the AI recommends
- A row of KPI tiles showing the metrics that matter most for your business
- Three insight cards: Biggest Risk, Biggest Opportunity, and Biggest Change each with a chart, a short narrative, and an Investigate button to drill in further
Use the period controls at the top to change what the summary is comparing.
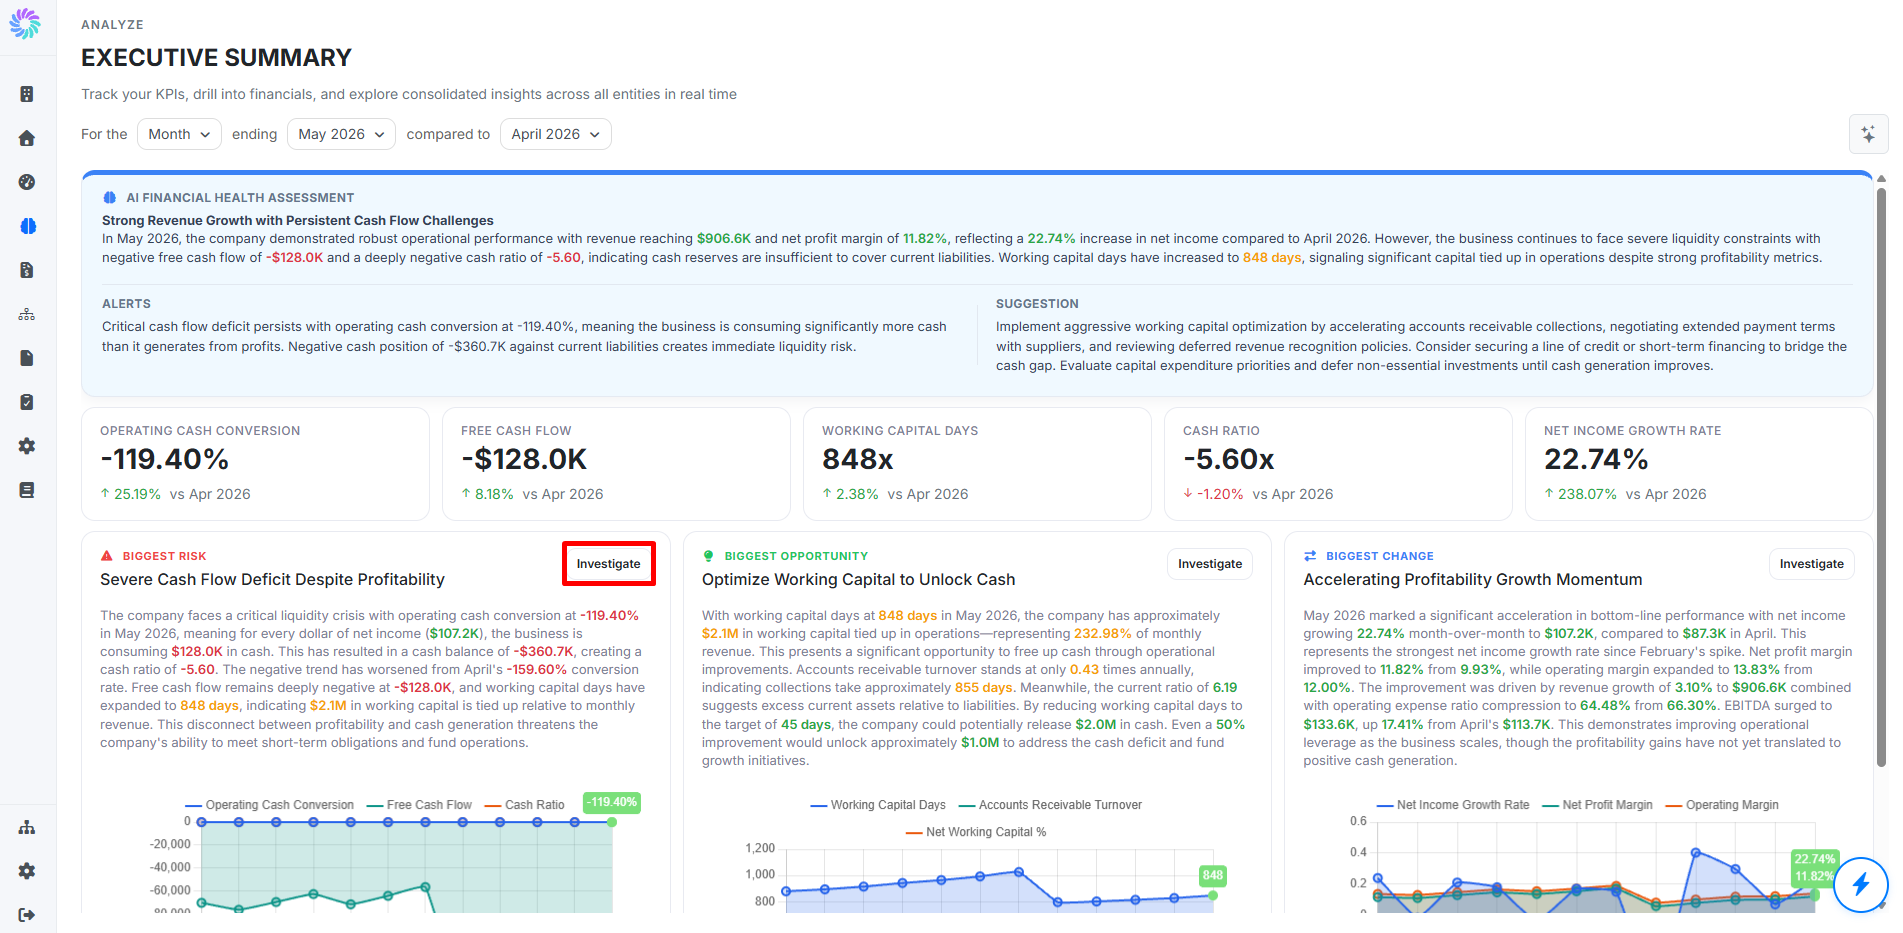
Click Investigate on any insight card to drill in. The button takes you directly to Account Intelligence with the relevant accounts already selected and the same period applied so you can move from a high-level headline to a detailed account-level analysis in one click, without manually setting any filters.
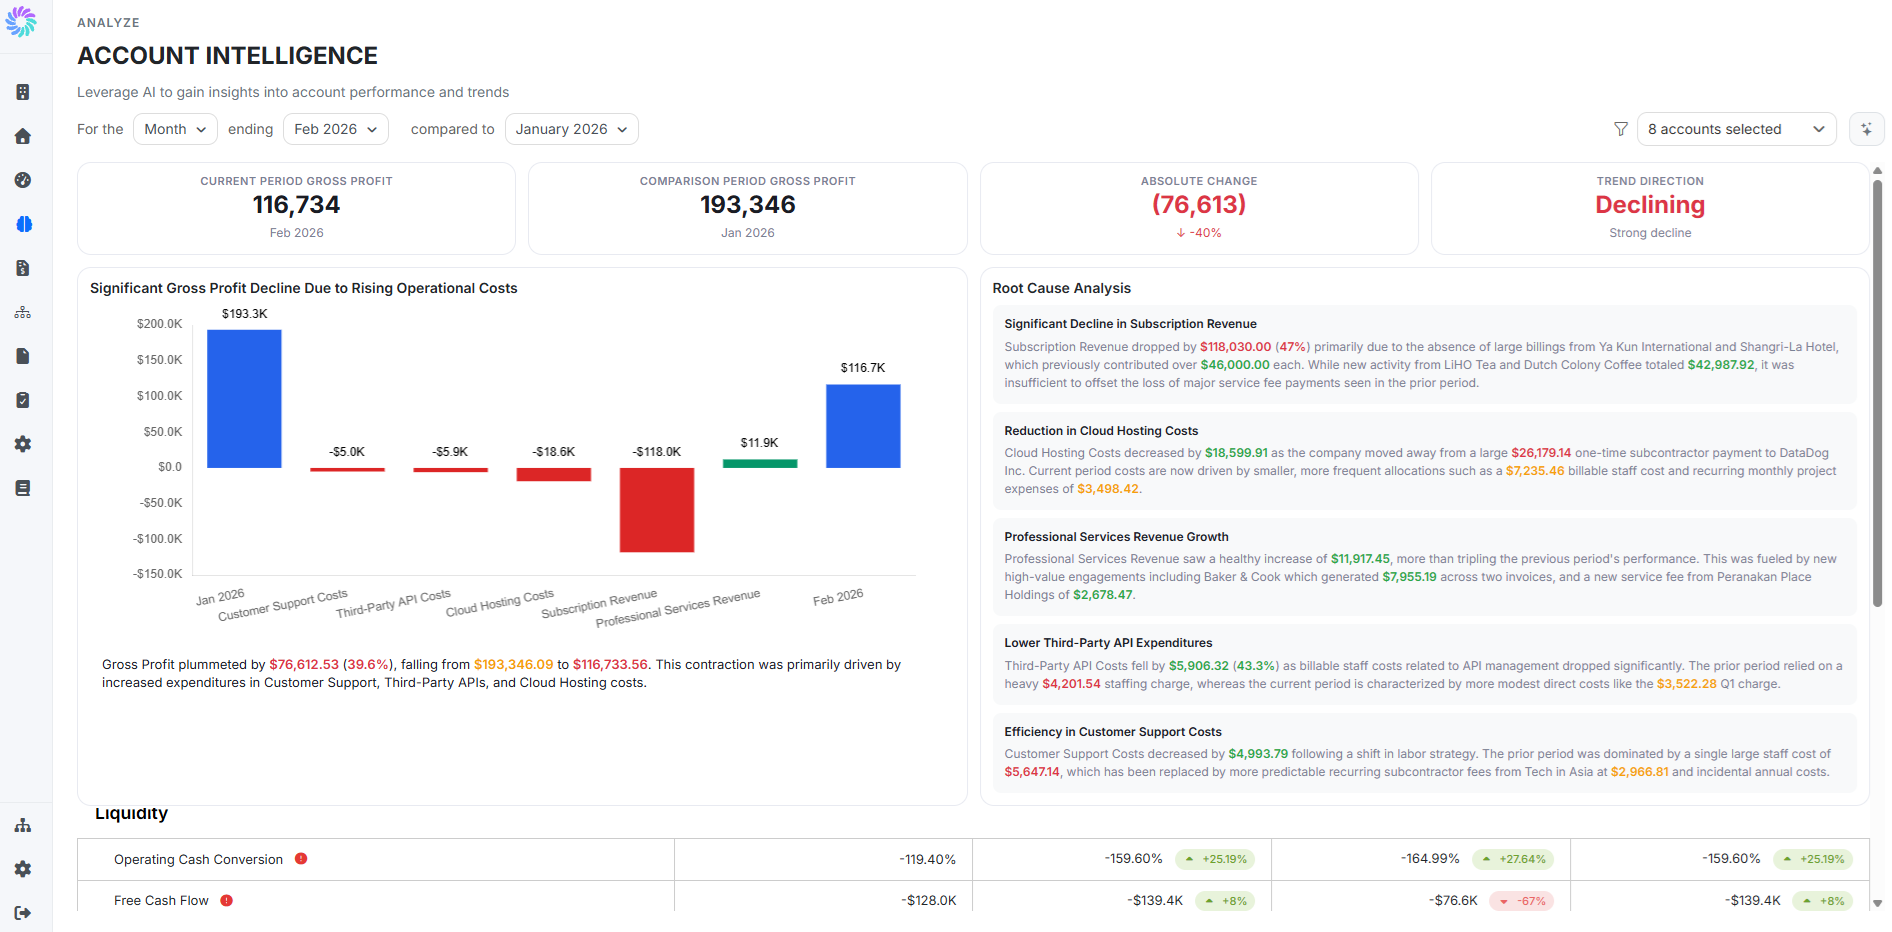
Step 3. Account Intelligence — Drill into a Specific Account
When you want to understand one account (or a group of accounts) in detail, open Account Intelligence.
What you'll see:
- A summary panel with current period revenue, comparison period, absolute change, and trend direction at a glance
- An Aggregated Revenue Growth Analysis chart showing how the selected accounts moved between periods
- A Root Cause Analysis section with AI-generated sub-sections explaining the drivers behind the change
- Additional charts and breakdowns covering performance trends and revenue composition
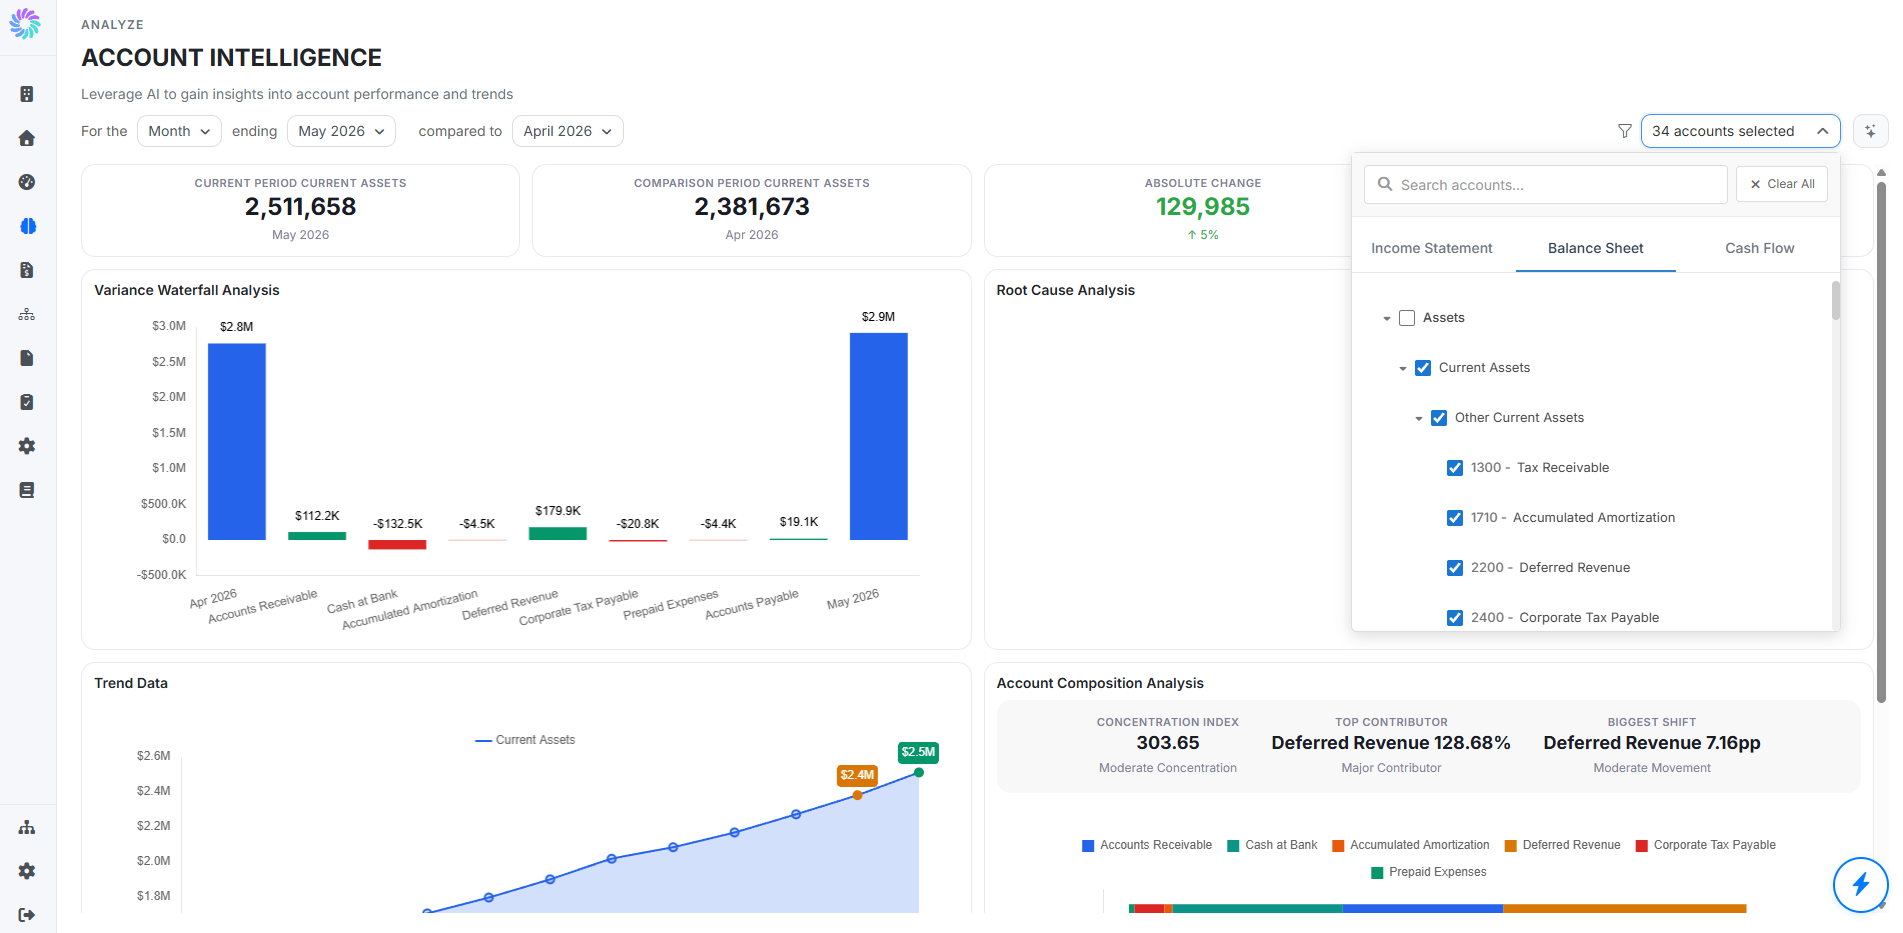
Use the accounts selected filter in the top right to choose which accounts to analyze. The filter is hierarchical and lets you pick across Income Statement, Balance Sheet, and Cash Flow so you can analyze any group of accounts together (for example, all your revenue accounts, or just one inventory line).
Step 4. Transaction Intelligence — Spot Unusual Activity
When you want to see individual transactions that look noteworthy or unusual, use Transaction Intelligence. The tool scans your General Ledger and surfaces transactions that warrant a second look, like large amounts, unusual timing, unfamiliar accounts, or other patterns the AI considers worth your attention. (Detailed walkthrough in the Transaction Intelligence article.)
Step 5. Common Controls Across All Three Tools
Every Intelligence tool shares the same pattern, so once you know one, you know all three:
- Period selector at the top — choose the period you're analyzing (e.g., May 2024) and the period you're comparing against (e.g., April 2024)
- Filter controls (top right) — narrow the analysis to specific accounts, dimensions, or scenarios
- AI sparkle icon (top right) — refresh or regenerate the AI analysis on demand
- Investigate buttons in the Executive Summary insight cards — open Account Intelligence with the relevant accounts pre-selected and the same period applied, so summary insights flow naturally into deeper analysis
Where to go next
Each tool has its own dedicated article that walks through every feature in depth:
- Executive Summary — Daily Briefing — full feature walkthrough
- Account Intelligence — filters, drill-downs, dimension slicing
- Transaction Intelligence — unusual transaction detection and review workflow