Forecasting Profit & Loss
The Profit & Loss page under Plan shows your historical and forecast P&L side by side. Every forecast cell can be drilled into and adjusted with projection rules and cash realization settings, so you can shape your revenue, cost, and profitability outlook without leaving the statement.
Why this matters
A static P&L tells you what happened. The Plan section makes the P&L interactive: you can model how revenue grows, how costs scale, and how cash hits the books across every future period. Because the rules sit on each individual line, you can take a top-down view (revenue grows 5% per month) or a bottom-up view (revenue grows because of one new wholesale customer) using the same screen.
When to use this
- When building or refreshing your monthly forecast
- When stress-testing assumptions on revenue or cost lines (for example, "what if salaries grow 8% instead of 5%?")
- When validating that activities created in Activity Forecast are flowing into the right accounts
- When preparing a forecast view to share with leadership or investors
Before You Start
Make sure you have:
- Your Chart of Accounts reviewed in Setup, Chart of Accounts so revenue and cost lines roll up correctly
- A clear view of the assumption you want to apply (growth rate, fixed amount, or a relationship to another account)
- Your Base Case scenario in place (created automatically when you connect a data source)
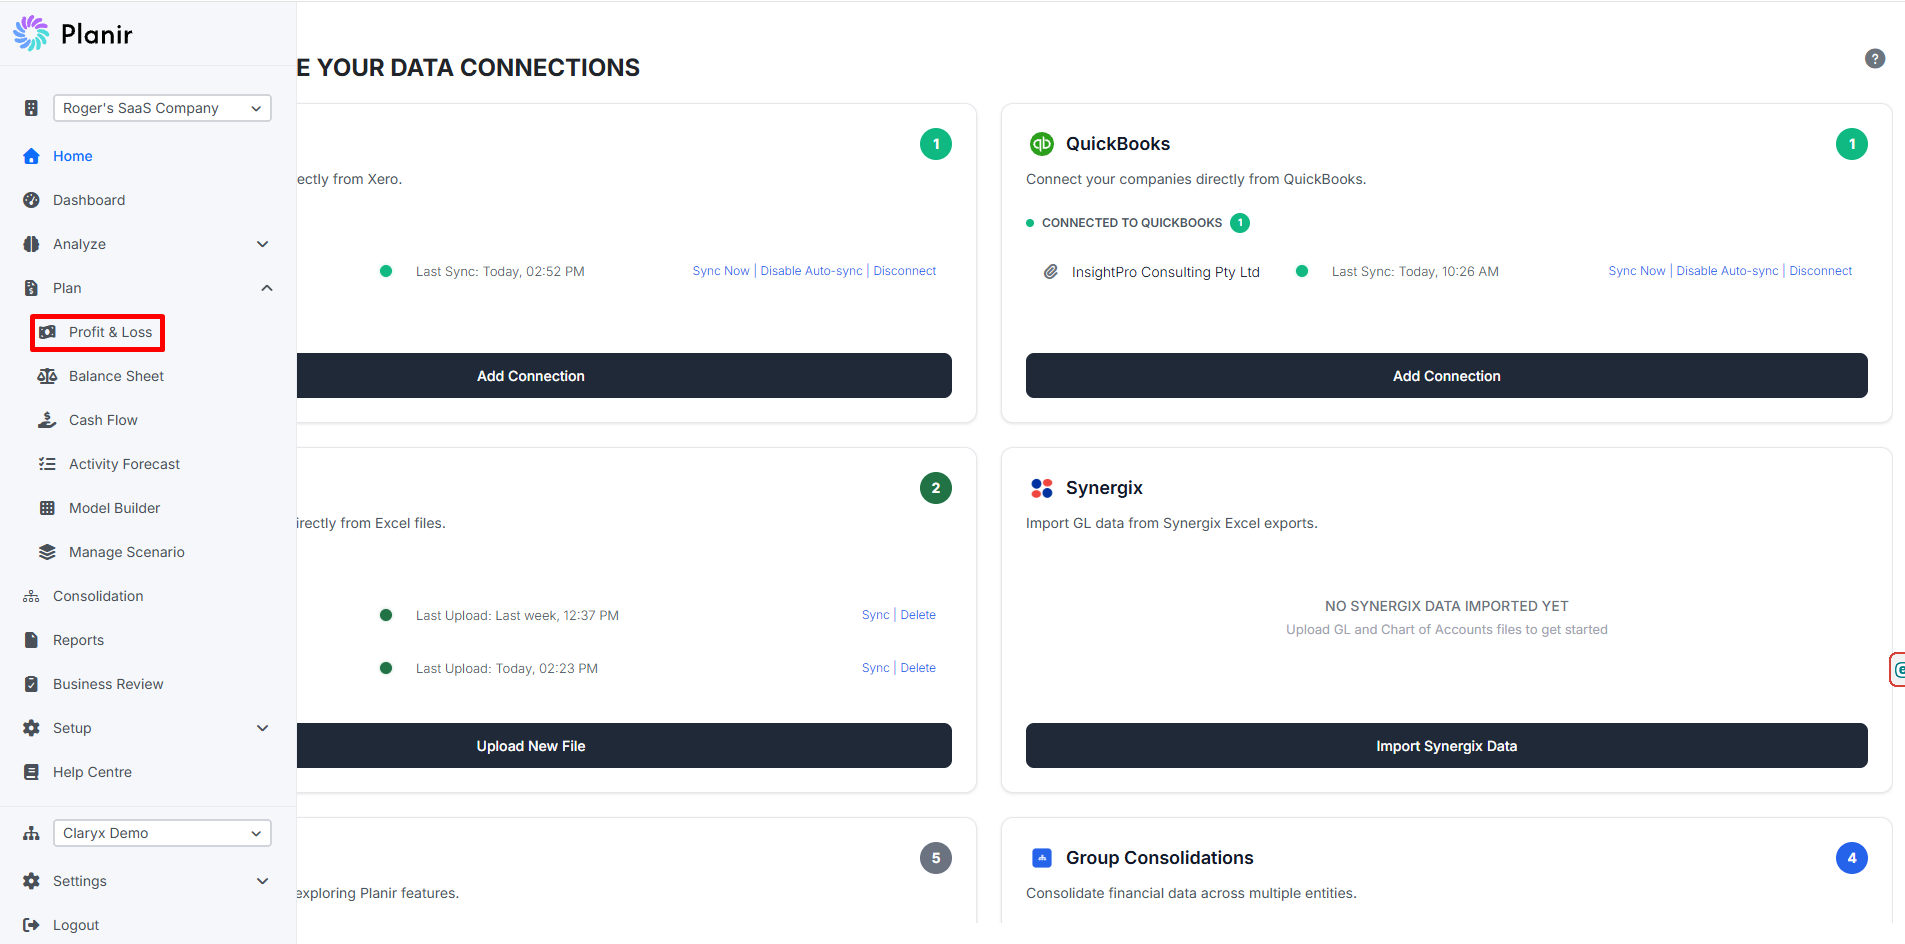
Step 1. Open the Profit & Loss Page
- From the sidebar, expand Plan.
- Click Profit & Loss.
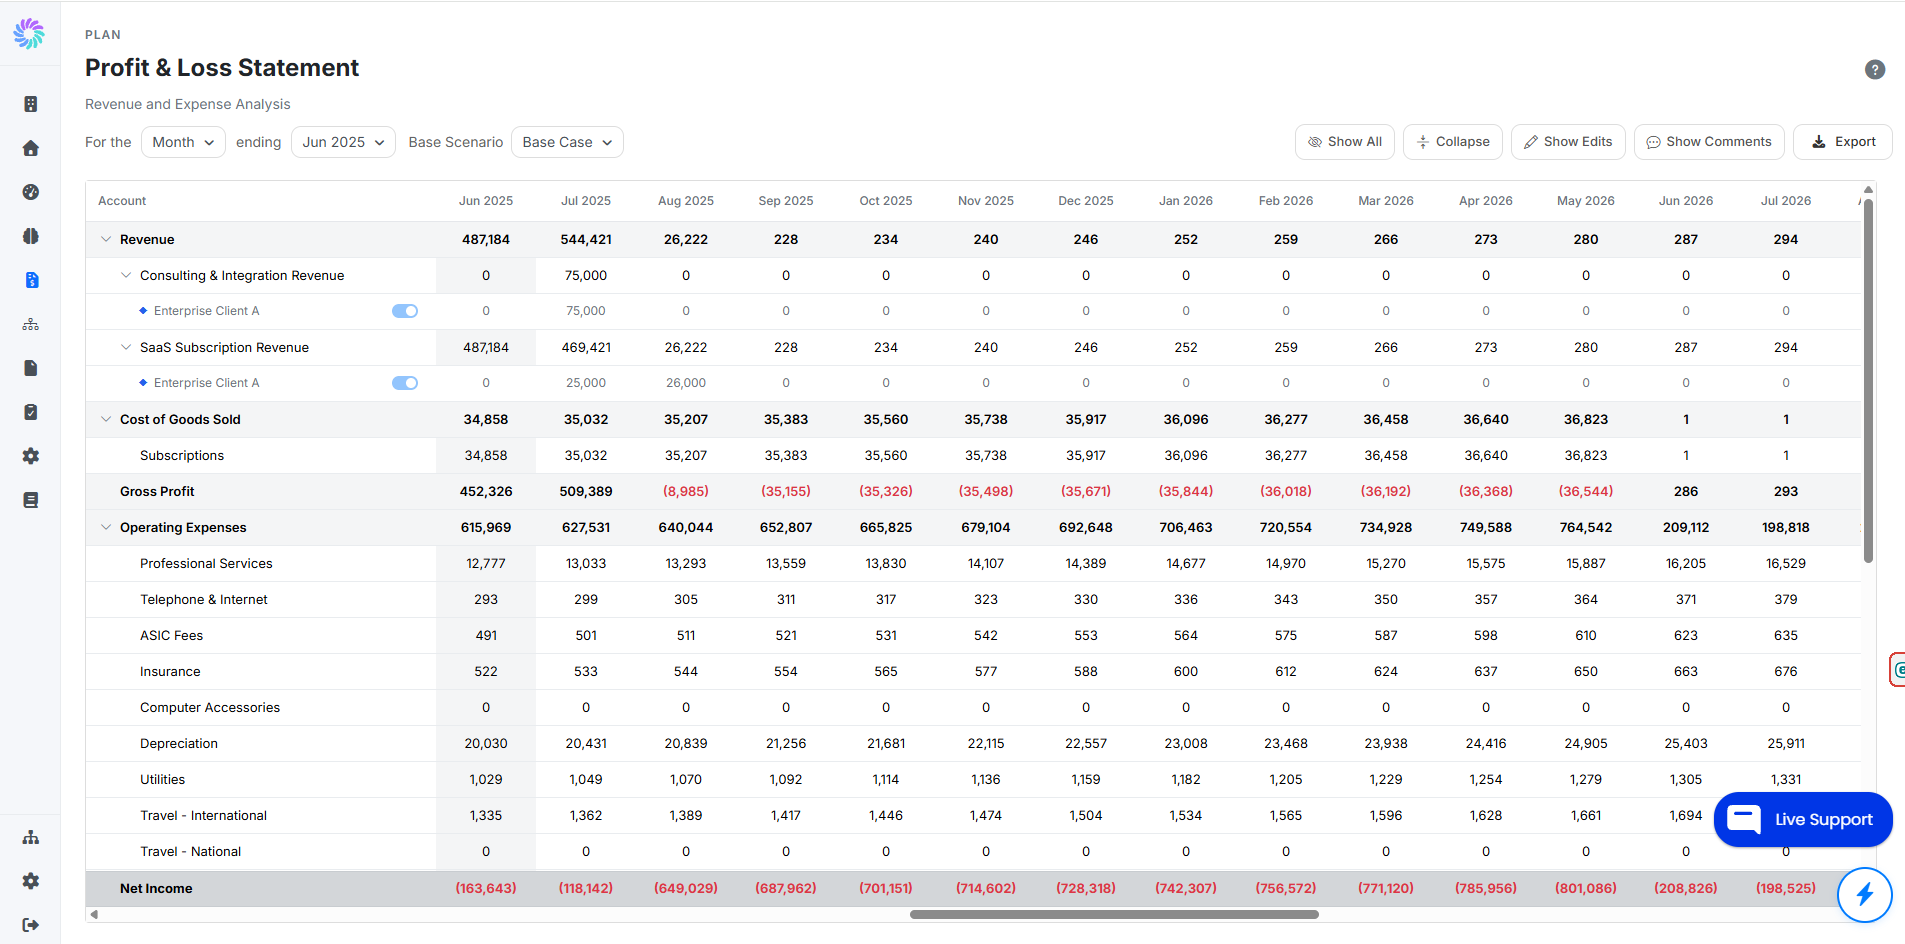
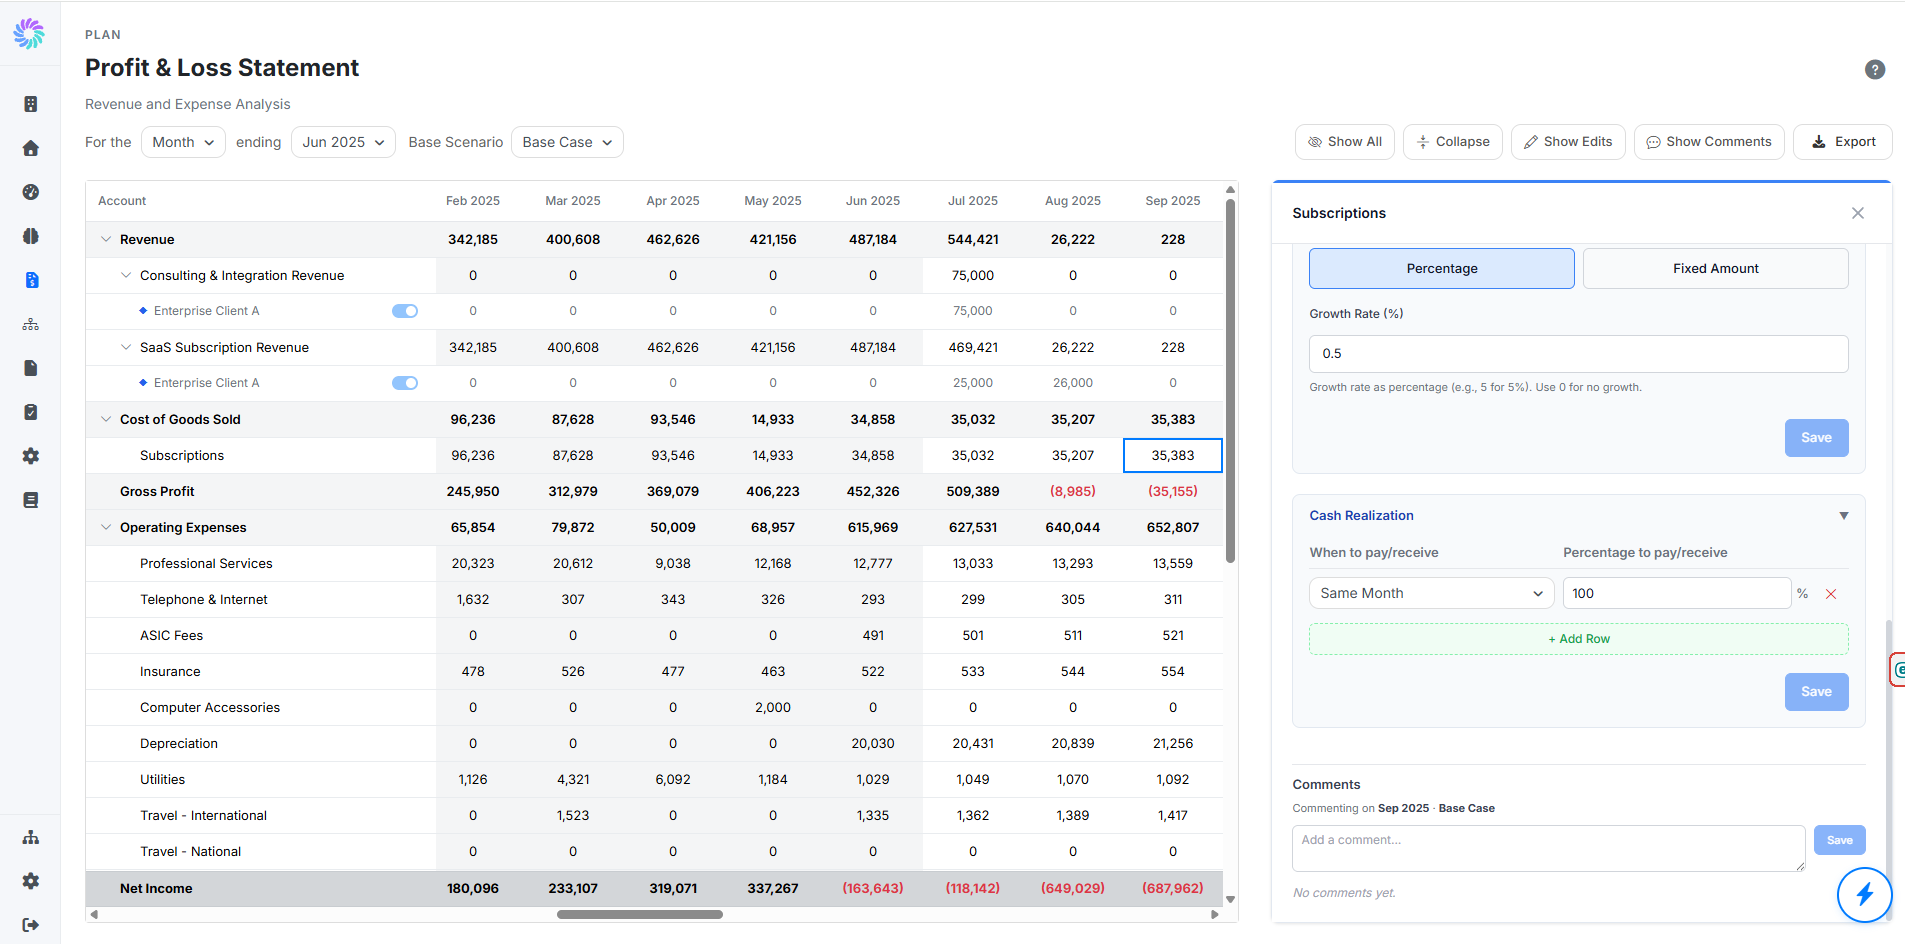
The Profit & Loss Statement opens with accounts grouped under their parent categories (Revenue, Cost of Goods Sold, Operating Expenses, etc.) and periods running across the top from your earliest historical month through your forecast horizon.
Use the controls at the top to set the period type (Month, Quarter, Year), the period end date, and the Base Scenario the forecast should reflect.
Step 2. Read the Layout
Each row is an account, and each column is a period. Bold roll-up rows like Gross Profit, Operating Expenses, and Net Income are calculated automatically from the rows beneath them.
Two visual cues are worth knowing:
- Activity-driven sub-rows appear under their parent account with a toggle next to them. Toggle activities on or off to include or exclude their impact on the forecast.
- Sub-items with values in italics or grey typically represent activity contributions to the parent account. The parent row sums those contributions together with the base account value.
Activities are created in Plan, Activity Forecast and surface here automatically.
Step 3. Drill Into a Forecast Cell
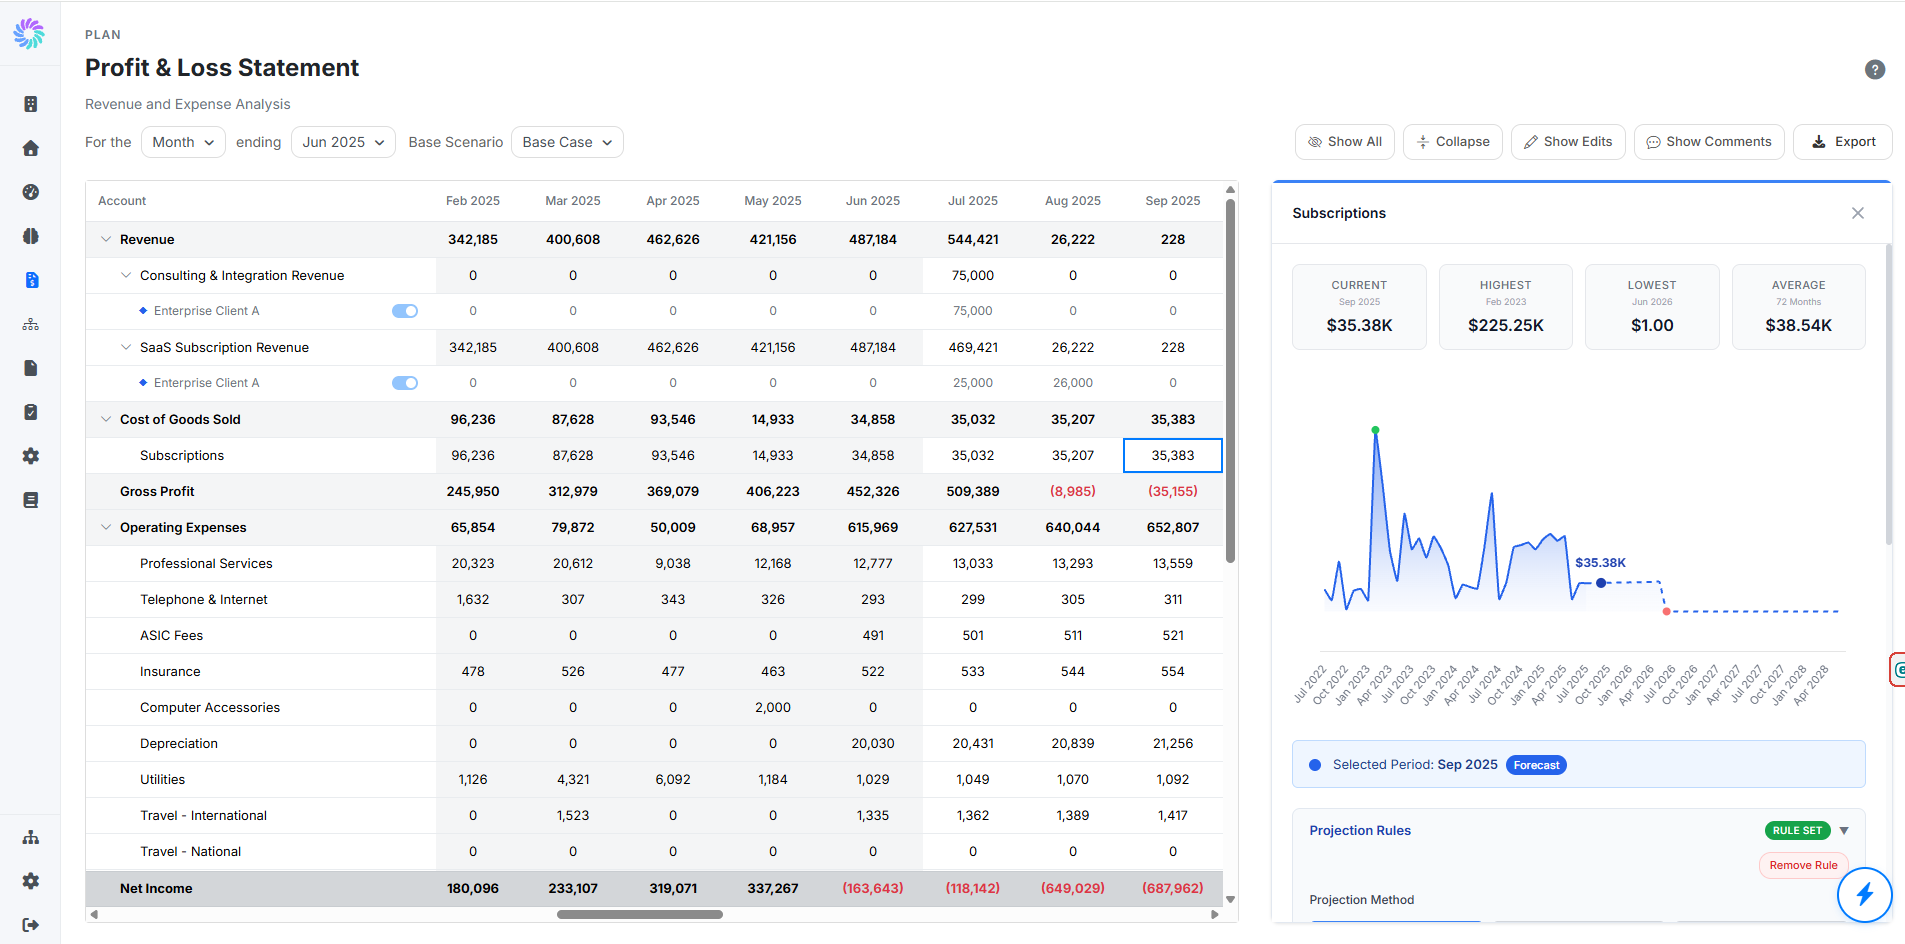
Click any forecast cell (a future period column) on a P&L line to open its detail panel on the right. The panel shows:
- Current, Highest, Lowest, Average tiles for the line over the visible time horizon
- A trend chart with a clear visual split between actual and forecast periods
- A Selected Period badge indicating whether the cell is Actual or Forecast
- A Projection Rules section with a Rule Set tag if a rule is already in place
This is where you go from looking at the forecast to shaping it.
Step 4. Configure Projection Rules
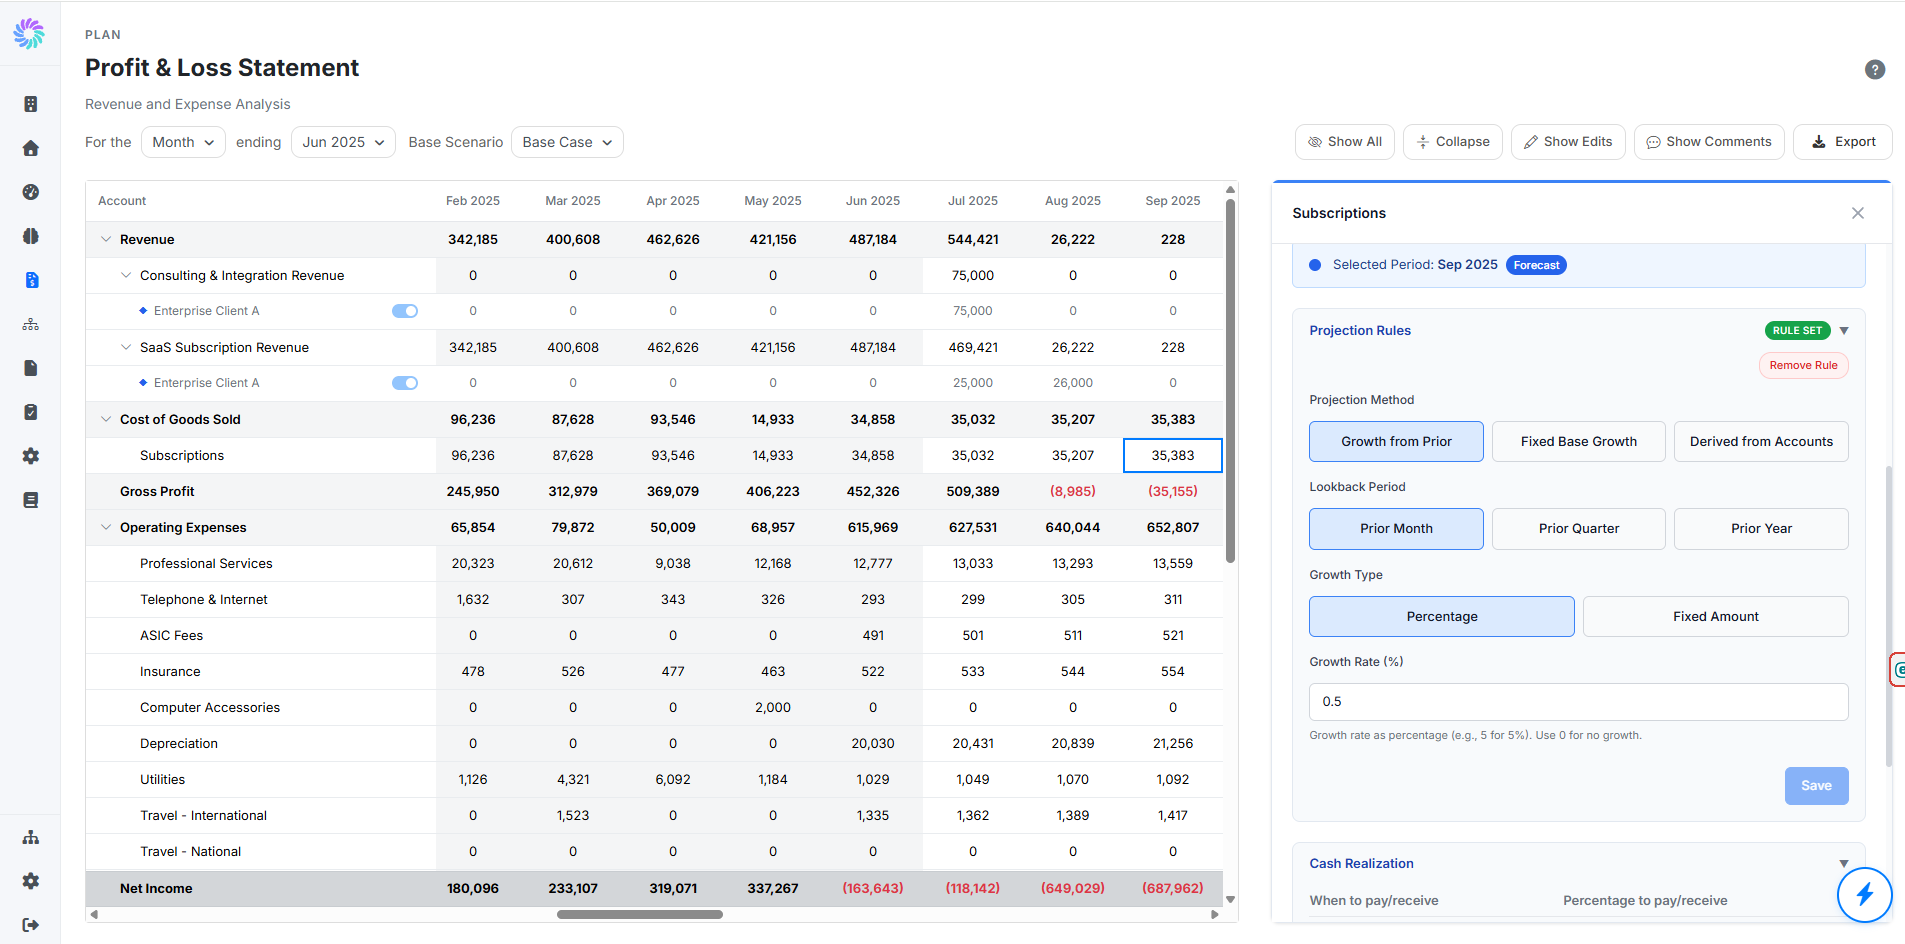
Scroll the detail panel to Projection Rules. There are three projection methods to choose from:
- Growth from Prior: apply a growth rate based on the prior month, quarter, or year
- Fixed Base Growth: apply a fixed dollar (or unit) growth on top of a base value
- Derived from Accounts: calculate the line as a function of one or more other accounts (useful for COGS as a percentage of Revenue, or a commission as a percentage of Sales)
For Growth from Prior:
- Pick a Lookback Period: Prior Month, Prior Quarter, or Prior Year
- Pick a Growth Type: Percentage or Fixed Amount
- Enter the Growth Rate (for example,
3for 3% growth, or0for no growth) - Click Save
A "Projection rule saved successfully" confirmation appears, and the forecast values for that account update across every future period in the table.
To remove a rule and revert the line to the company default projection, click Remove Rule at the top of the Projection Rules section.
Step 5. Set Cash Realization
Cash Realization controls when the cash for a P&L line actually hits the cash flow. By default, every line is set to Same Month at 100%, meaning the full amount is realized in the same period it appears on the P&L.
To change it:
- Scroll to the Cash Realization section in the detail panel.
- Set When to pay/receive (for example, Same Month, Next Month, or a longer offset).
- Set Percentage to pay/receive (for example,
100for the full amount in that timing). - To split realization across multiple periods (for example, 50% in Same Month and 50% in Next Month), click + Add Row and configure the second row.
- Click Save.
Cash Realization rules are particularly important for revenue lines (where customers pay on terms) and for expenses with payment schedules different from when they accrue.
Step 6. Add Comments (Optional)
Use the Comments section at the bottom of the detail panel to leave notes on a specific period and scenario combination (for example, "Aug 2025 Base Case"). Comments are useful for documenting assumptions or starting a discussion with a teammate reviewing the forecast.