Forecasting Balance Sheet
The Balance Sheet page under Plan shows your historical and forecast Balance Sheet side by side. Most balance sheet movements flow automatically from your forecast P&L, but you can also drill into any line to see exactly what is driving its movement and create manual journals for one-off adjustments that do not come from the P&L.
Why this matters
A balance sheet without forecasting tells you where you stand today. The Plan section lets you project where you will stand at the end of every future period, with full transparency into what is driving each balance. Because most balance sheet activity comes from the P&L (cash falls when expenses are paid, accounts receivable rises when revenue is booked), the Balance Sheet acts as the financial impact view of every assumption you set in the P&L. Manual journals let you adjust for things the P&L does not capture, like loan repayments, asset purchases, or equity injections.
When to use this
- When projecting your cash position over the next 12 to 24 months
- When validating that your P&L assumptions land on a healthy balance sheet
- When recording a one-off adjustment that does not flow naturally from the P&L (for example, drawing down a loan, purchasing equipment, or paying down debt)
- When investigating why a balance sheet line is moving the way it is
Before You Start
Make sure you have:
- Your P&L assumptions in place (see Forecasting Profit & Loss), since many balance sheet movements derive from there
- Your Cash Realization rules configured on revenue and expense lines so cash movements are timed correctly
- A clear view of any one-off adjustments you need to journal in (such as planned loan drawdowns or asset purchases)
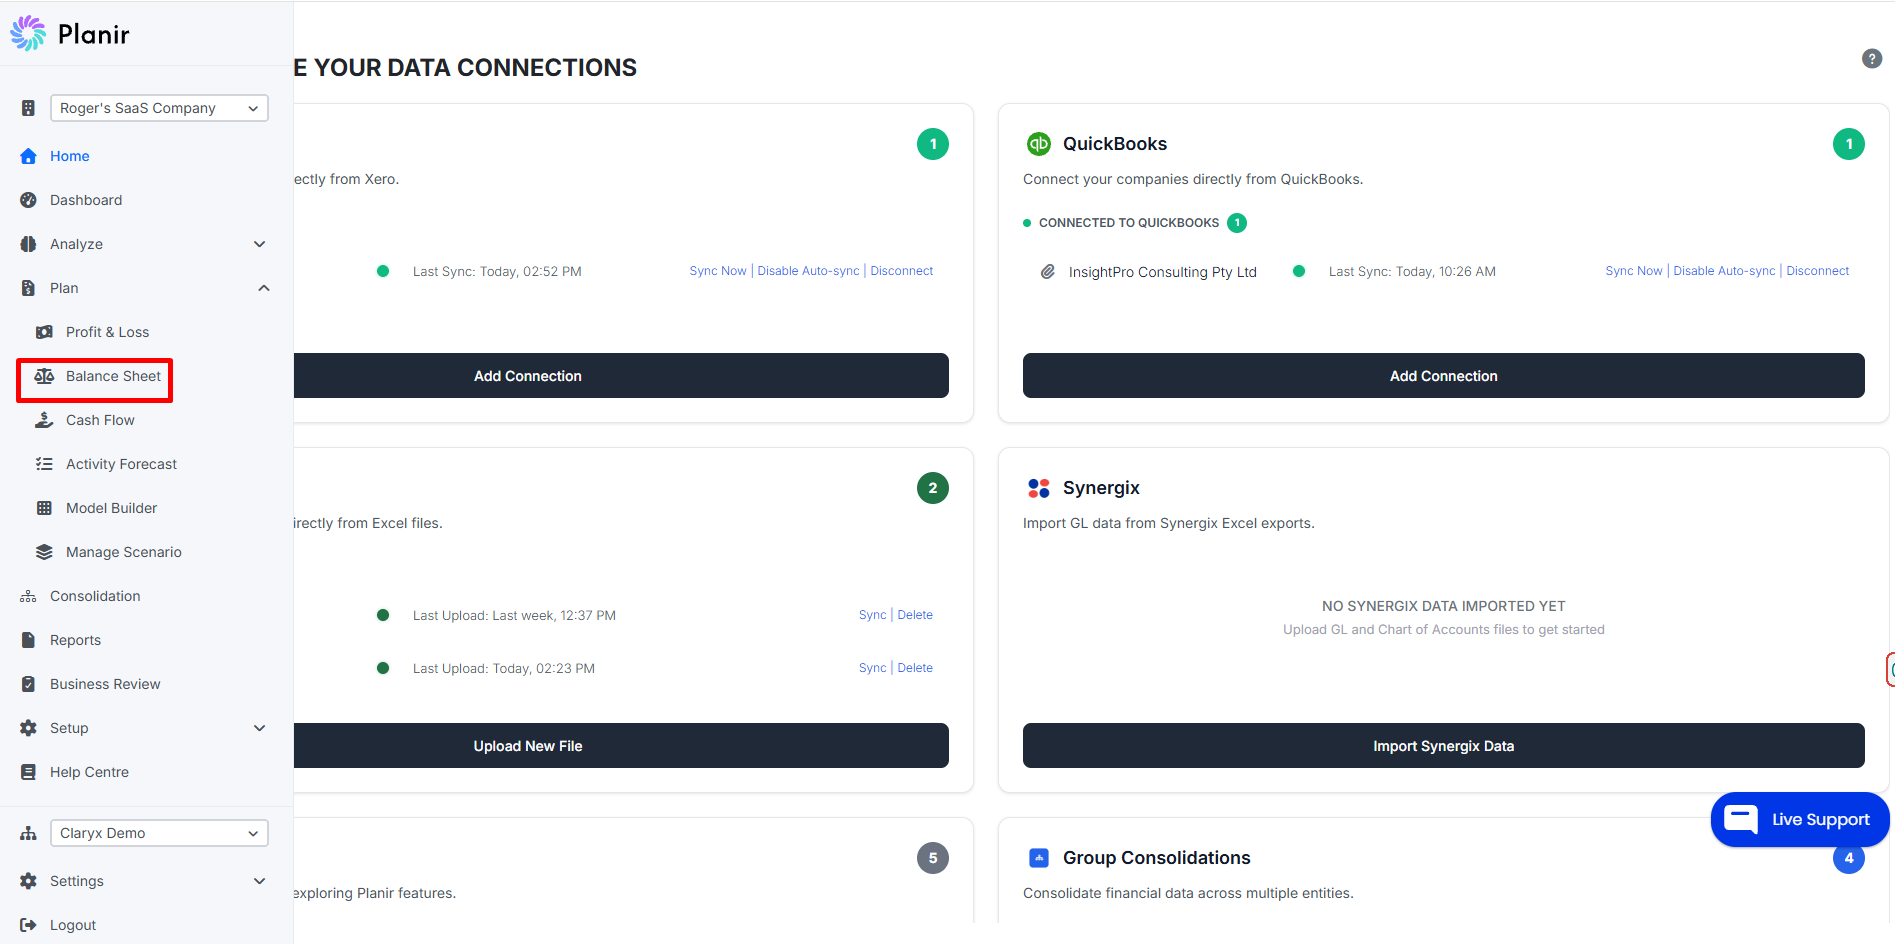
Step 1. Open the Balance Sheet Page
- From the sidebar, expand Plan.
- Click Balance Sheet.
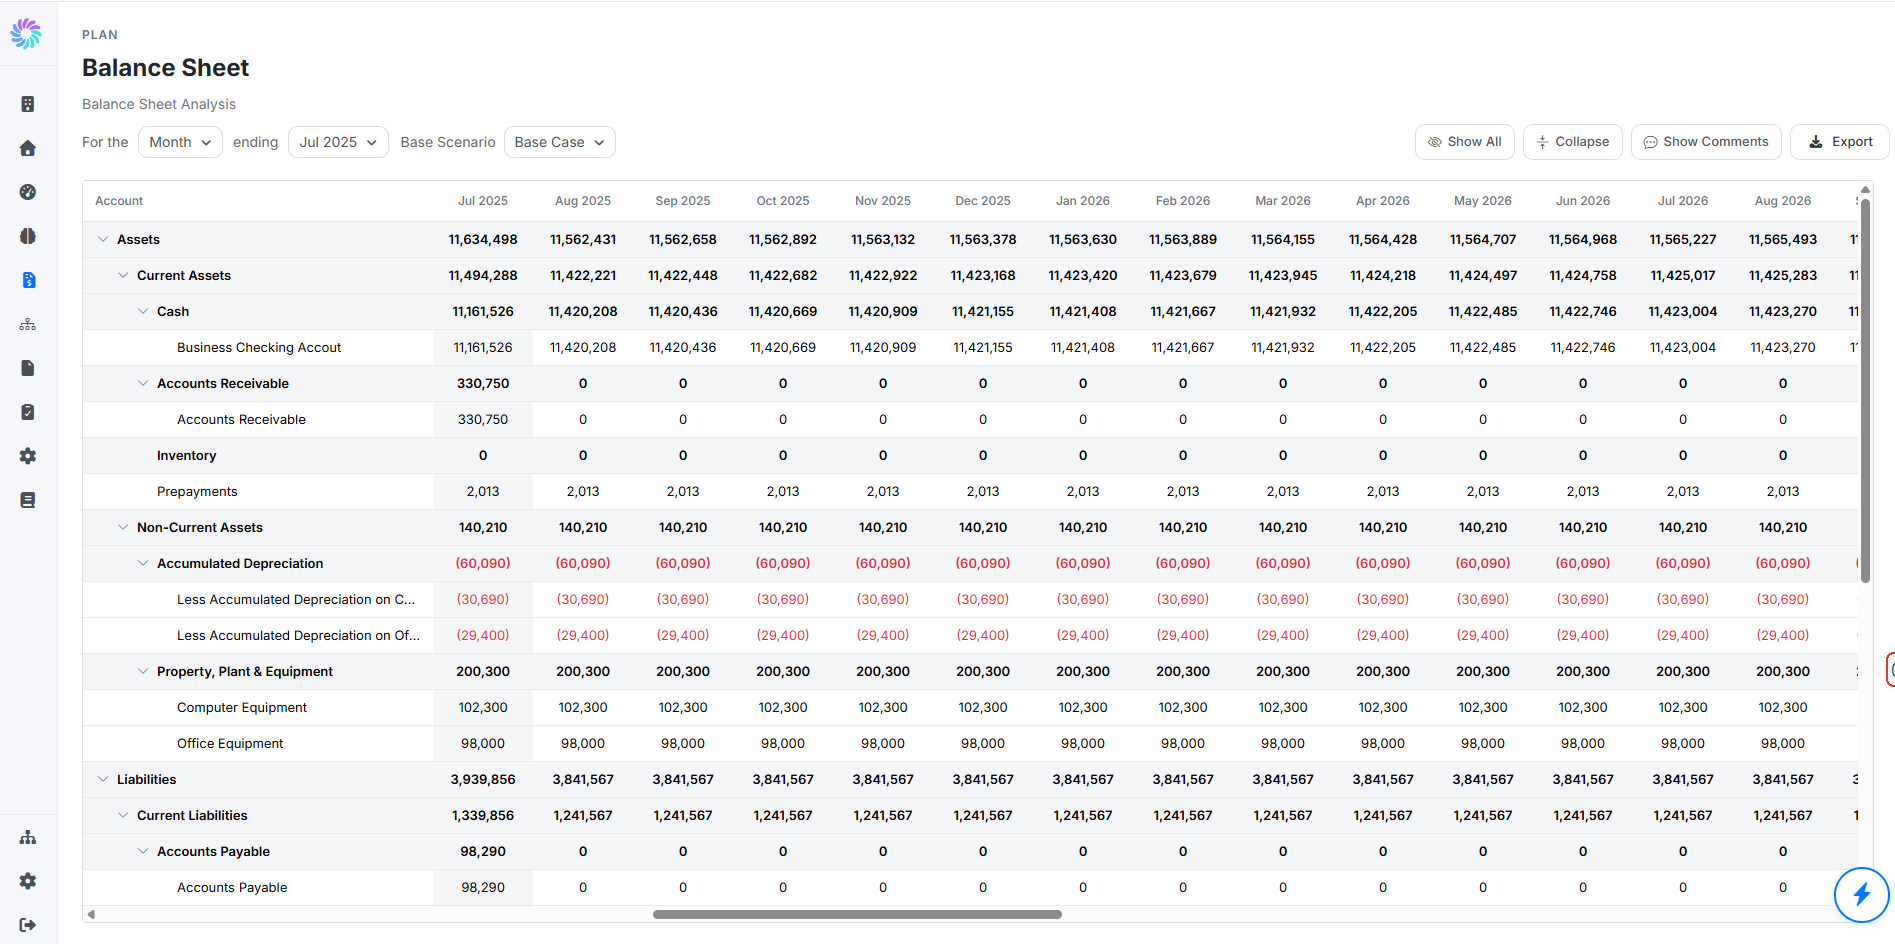
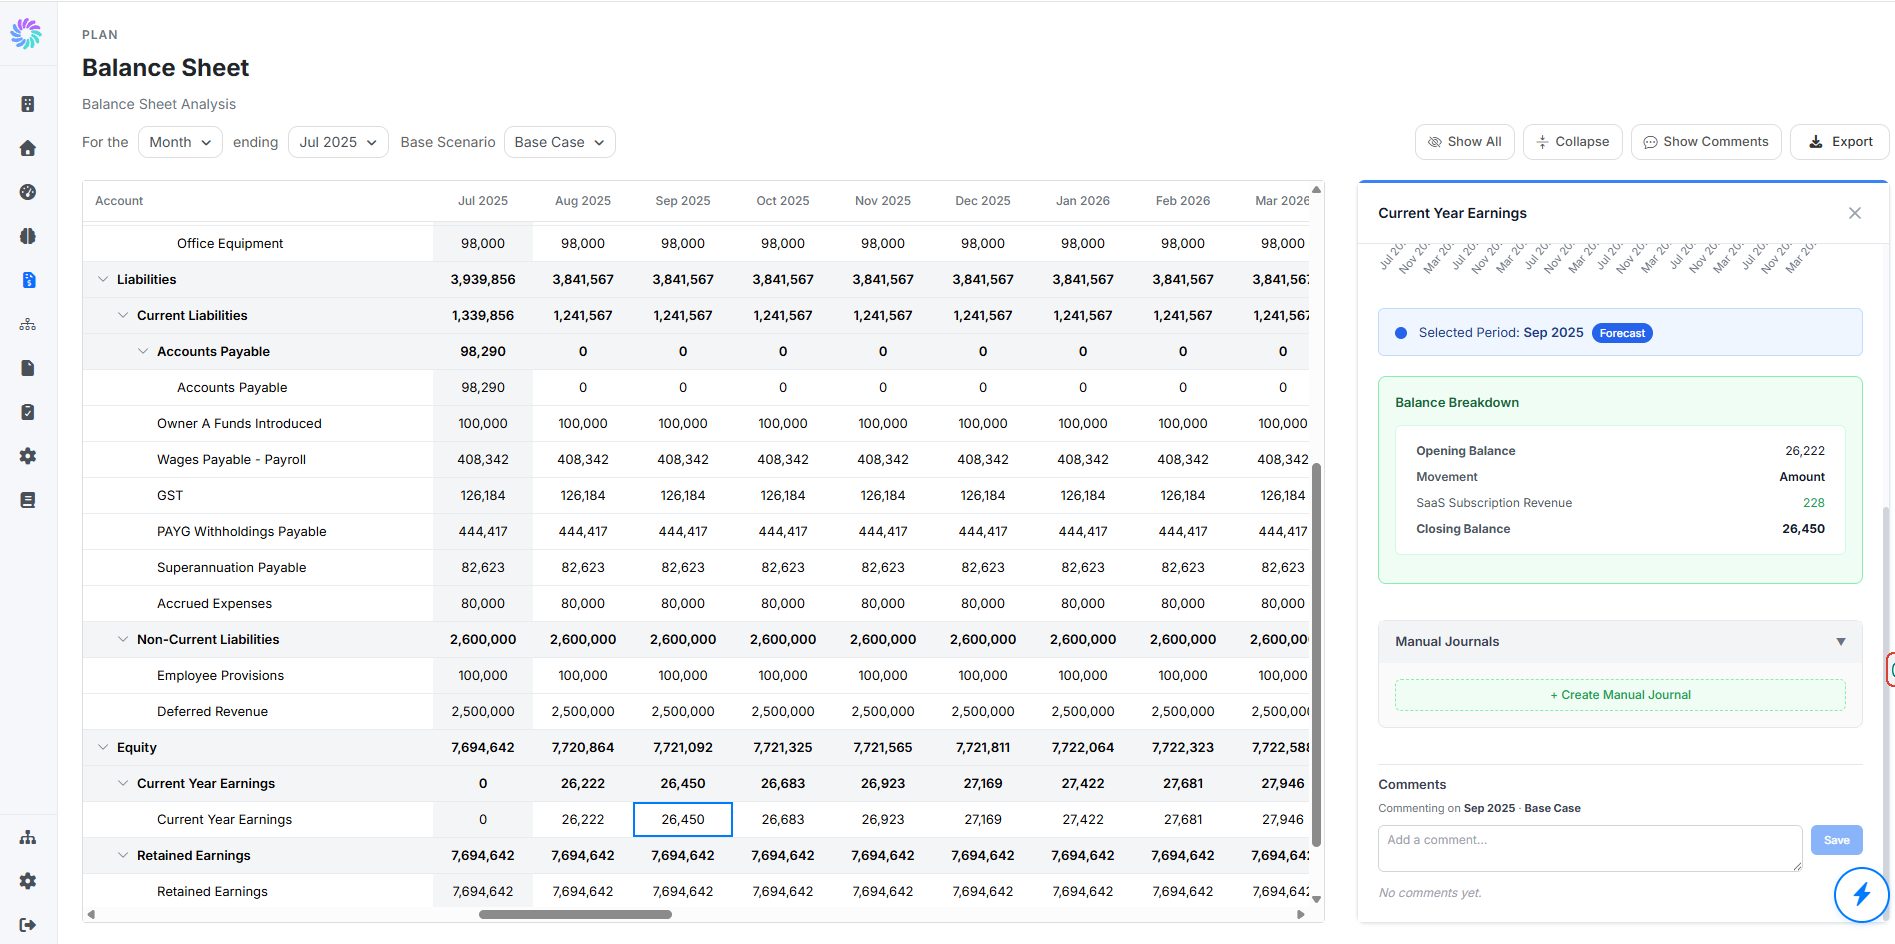
The Balance Sheet opens with accounts grouped under their parent categories (Assets, Current Assets, Non-Current Assets, Liabilities, Current Liabilities, Equity, etc.) and periods running across the top from your earliest historical month through your forecast horizon.
Use the controls at the top to set the period type (Month, Quarter, Year), the period end date, and the Base Scenario the forecast should reflect.
Step 2. Read the Layout
Each row is a balance sheet account, and each column is the closing balance at the end of that period. Bold roll-up rows like Current Assets, Non-Current Assets, and Liabilities are calculated automatically from the rows beneath them.
Negative balances (such as Accumulated Depreciation) appear in parentheses and red, following standard accounting convention.
Step 3. Drill Into a Forecast Cell
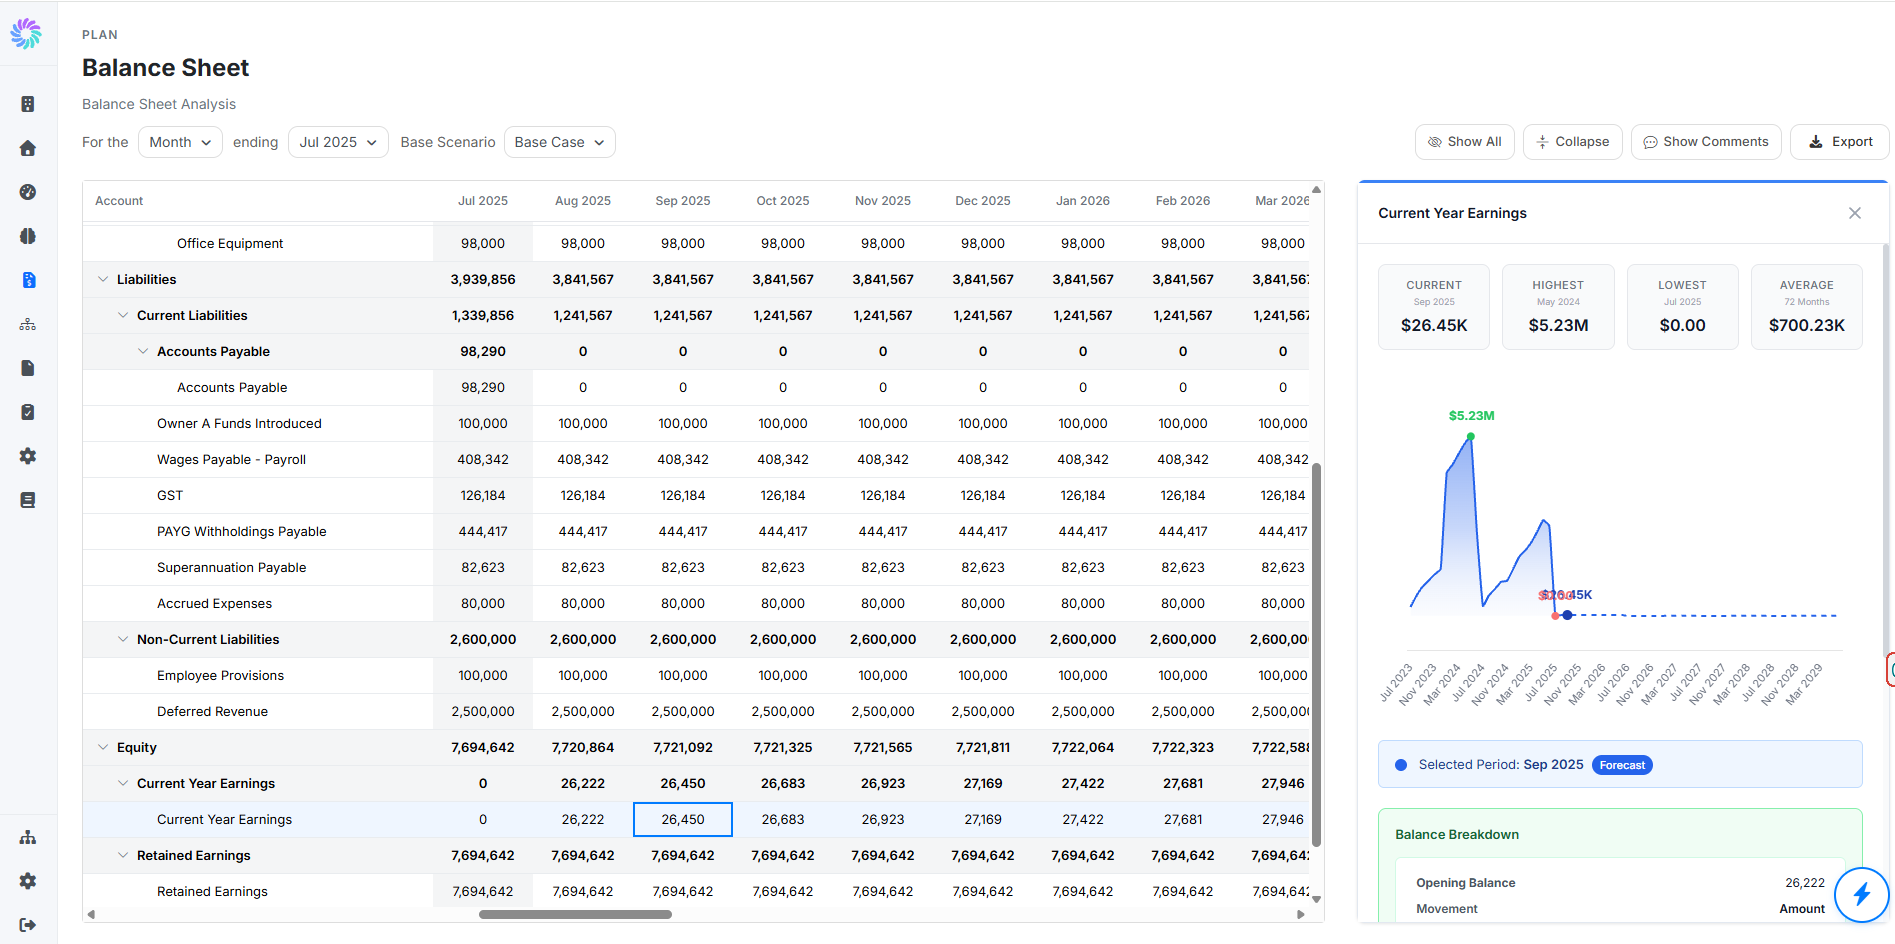
Click any forecast cell on a balance sheet line to open its detail panel on the right.
The panel shows:
- Current, Highest, Lowest, Average tiles for the line over the visible time horizon
- A trend chart with a clear visual split between actual and forecast periods
- A Selected Period badge indicating whether the cell is Actual or Forecast
- A Balance Breakdown section showing exactly how the period's balance was built
- A Manual Journals section for one-off adjustments
- A Comments section for collaboration
Step 4. Understand the Balance Breakdown
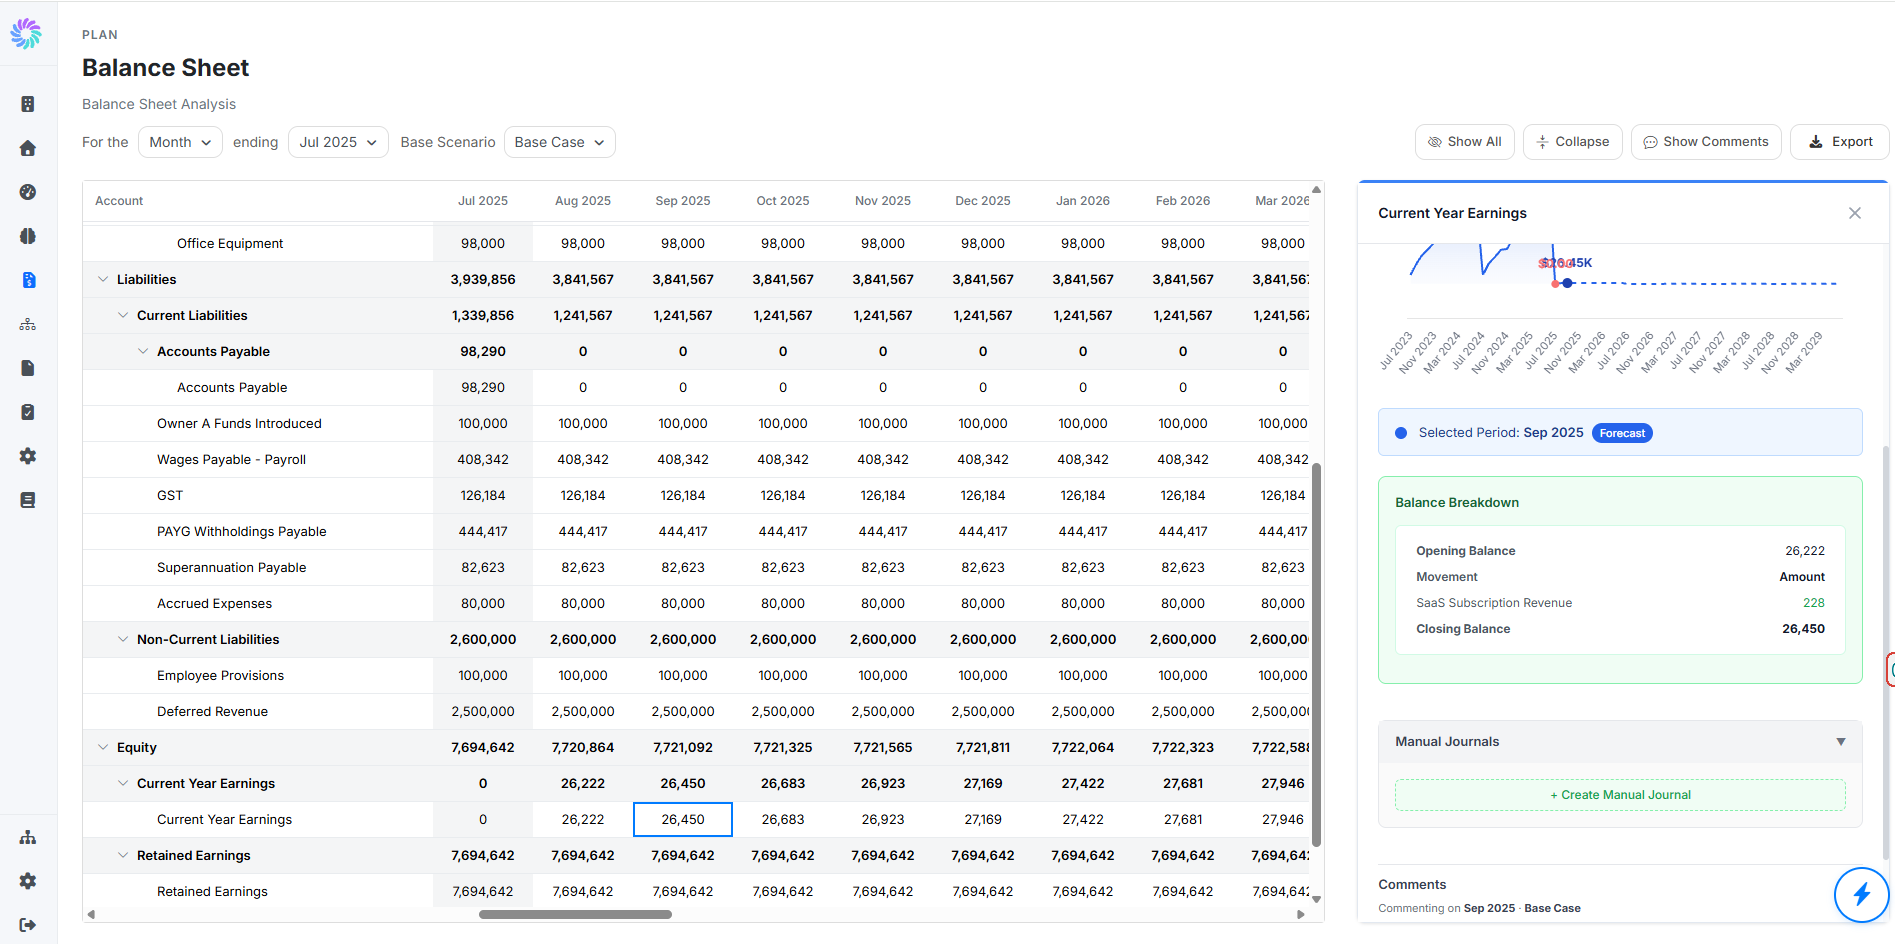
Scroll the detail panel to Balance Breakdown. This section shows you exactly how the closing balance for the selected period was calculated:
- Opening Balance: the closing balance of the prior period
- Movement: every individual driver that increased or decreased the balance during the period (for example, on a Cash account, the movement might list every operating expense and every revenue receipt)
- Closing Balance: the period's closing balance, which is Opening Balance plus the sum of all movements
This is a powerful diagnostic view. If the closing balance for a future period looks wrong, the Balance Breakdown shows you which P&L lines or activities are driving it, so you can go back to the P&L and adjust the right assumption.
Most balance sheet lines update automatically as you change P&L projection rules, Cash Realization timings, and activities in Plan, Activity Forecast.
Step 5. Create a Manual Journal
Some balance sheet movements do not flow naturally from the P&L. These include loan drawdowns and repayments, asset purchases, share issuances, and other one-off transactions. Use Manual Journals to record them directly on the forecast.
- In the detail panel, scroll to Manual Journals.
- Click + Create Manual Journal.
- In the New Journal form:
- Enter a clear Description (for example, "Equipment purchase for new store" or "Loan drawdown from bank")
- Add the accounts on the + (debit) or − (credit) side, with the correct Amount
- Click + Add Line to add additional debit or credit lines as needed
When the Journal is balanced indicator turns green (debits equal credits), click Save Journal.
The journal is applied to the selected forecast period, and the Balance Breakdown updates immediately to reflect the new movement.
To delete a manual journal later, reopen the detail panel for any account it touches, find it in the Manual Journals list, and remove it.
Step 6. Add Comments (Optional)
Use the Comments section at the bottom of the detail panel to leave notes on a specific period and scenario combination. Comments are useful for documenting why a particular manual journal was made or for raising a question with a teammate reviewing the forecast.