Executive Summary - Daily Briefing
The Executive Summary page is your AI-generated dashboard for the financial period. It pulls together a one-paragraph health assessment, alerts, a suggestion, headline KPIs, and three "biggest" cards (Risk, Opportunity, Change) so you can see what matters in 30 seconds. Each card is clickable and takes you into Account Intelligence to investigate the underlying numbers.
Why this matters
Closing a period or preparing for a board meeting usually means scrolling through every account to figure out where to focus. The Executive Summary does the triage for you. The AI reads your consolidated financials, weighs them against the comparison period you select, and surfaces what has gone right, what has gone wrong, and what has changed. You read it, decide what to dig into, and click through.
When to use this
- Right after closing a period, to set the agenda for review
- Before a board, leadership, or investor meeting, to anchor the discussion
- Whenever you want a quick read on financial health without building a custom view
- As a starting point for variance work, since the Biggest Risk card often points straight at the account that needs explaining
Before You Start
Make sure you have:
- Connected data sources so actuals are loaded for the period you want to summarize
- The correct entity or group selected in the sidebar dropdown, so the summary covers the scope you intend
- Your AI Summary Preferences considered, so the AI emphasizes the metrics and themes you care about for this audience
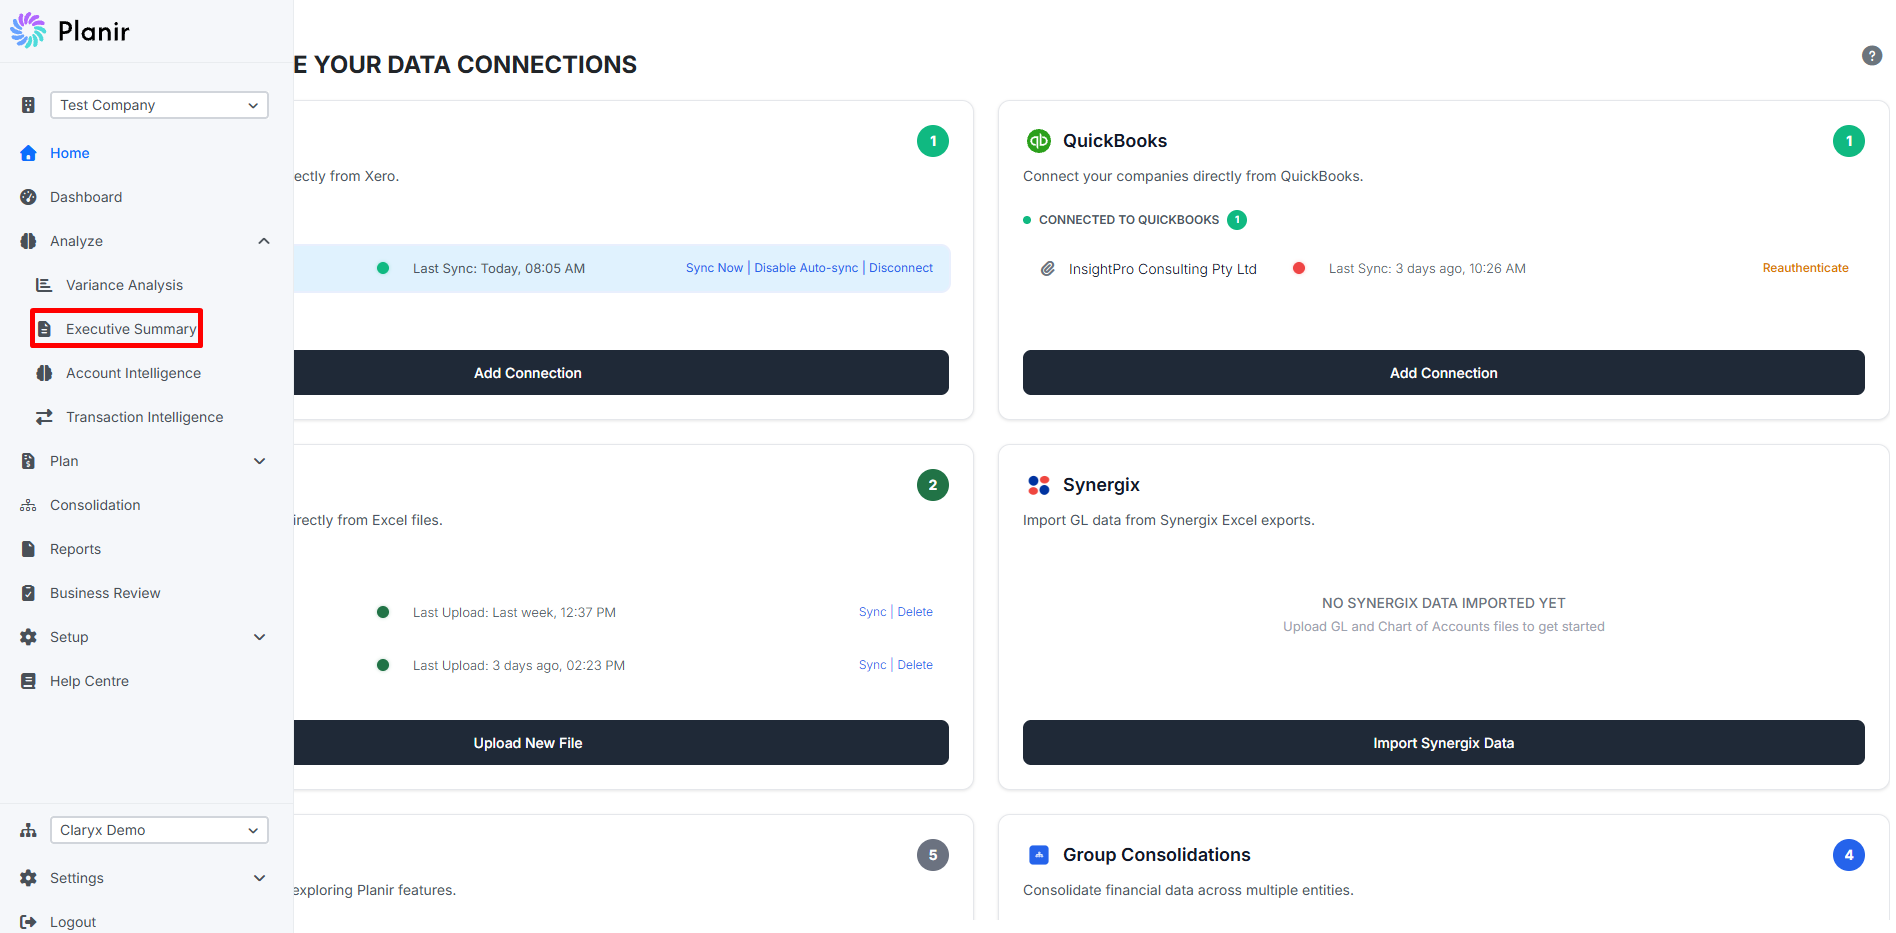
Step 1. Open the Executive Summary Page
- From the sidebar, expand Analyze.
- Click Executive Summary.
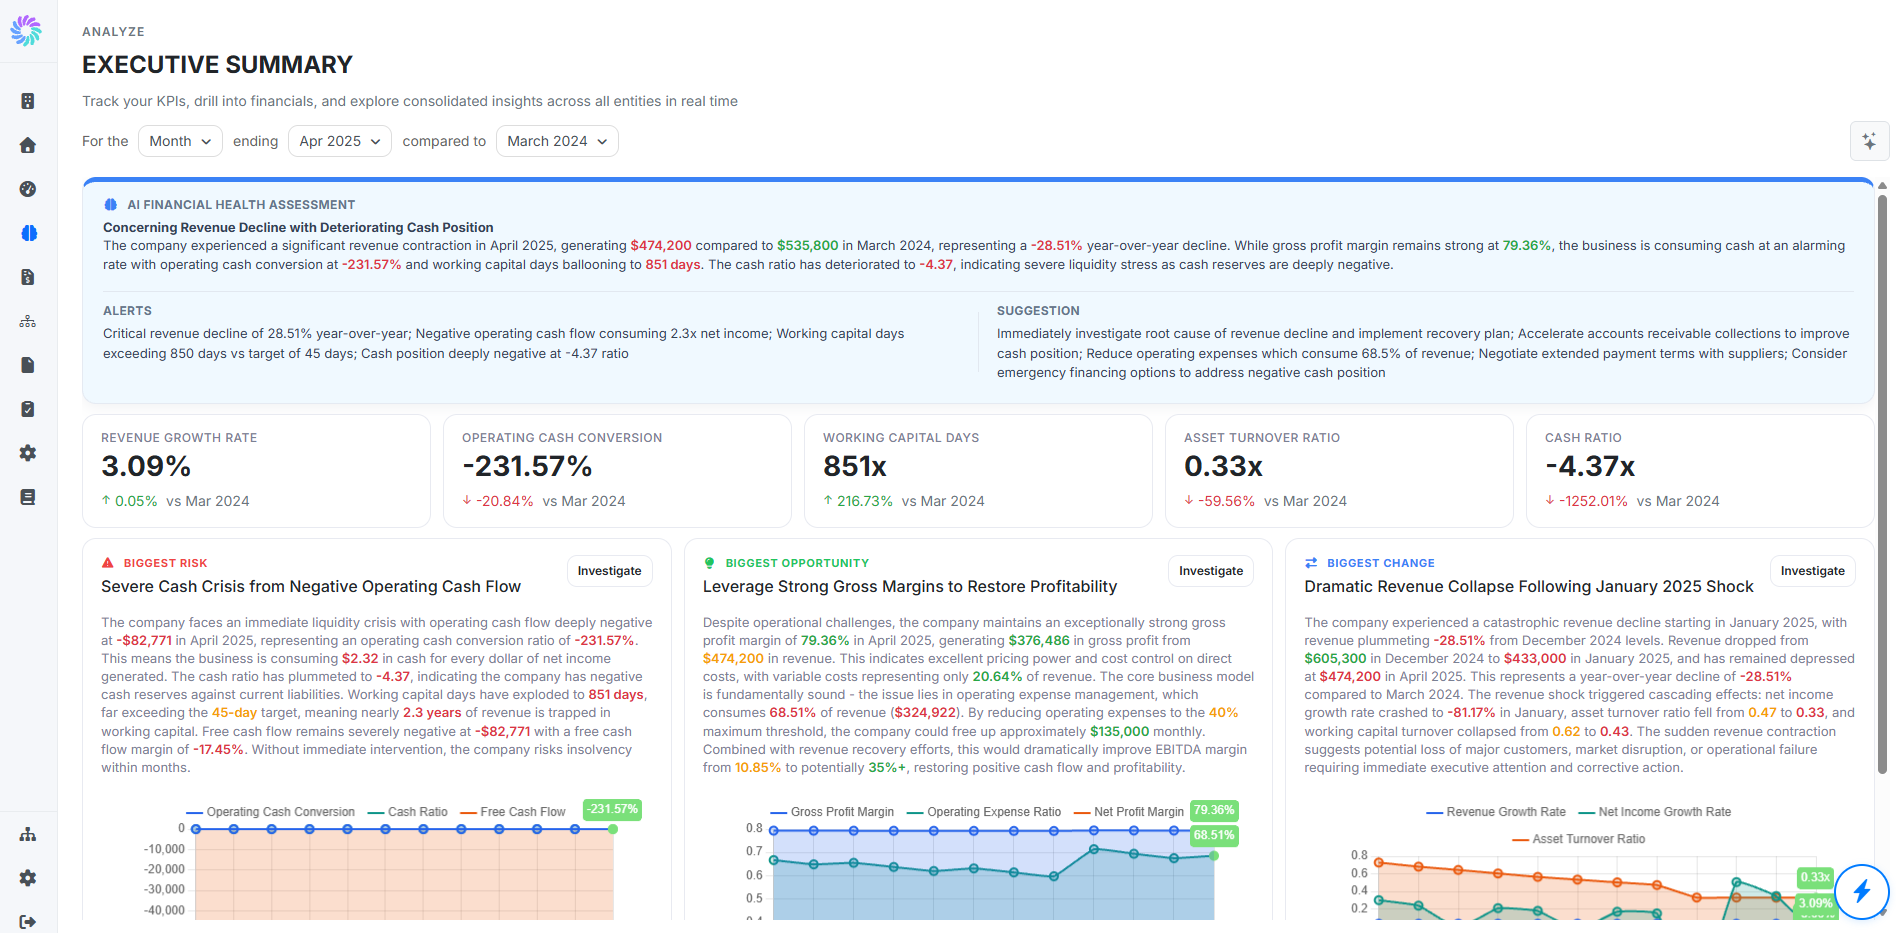
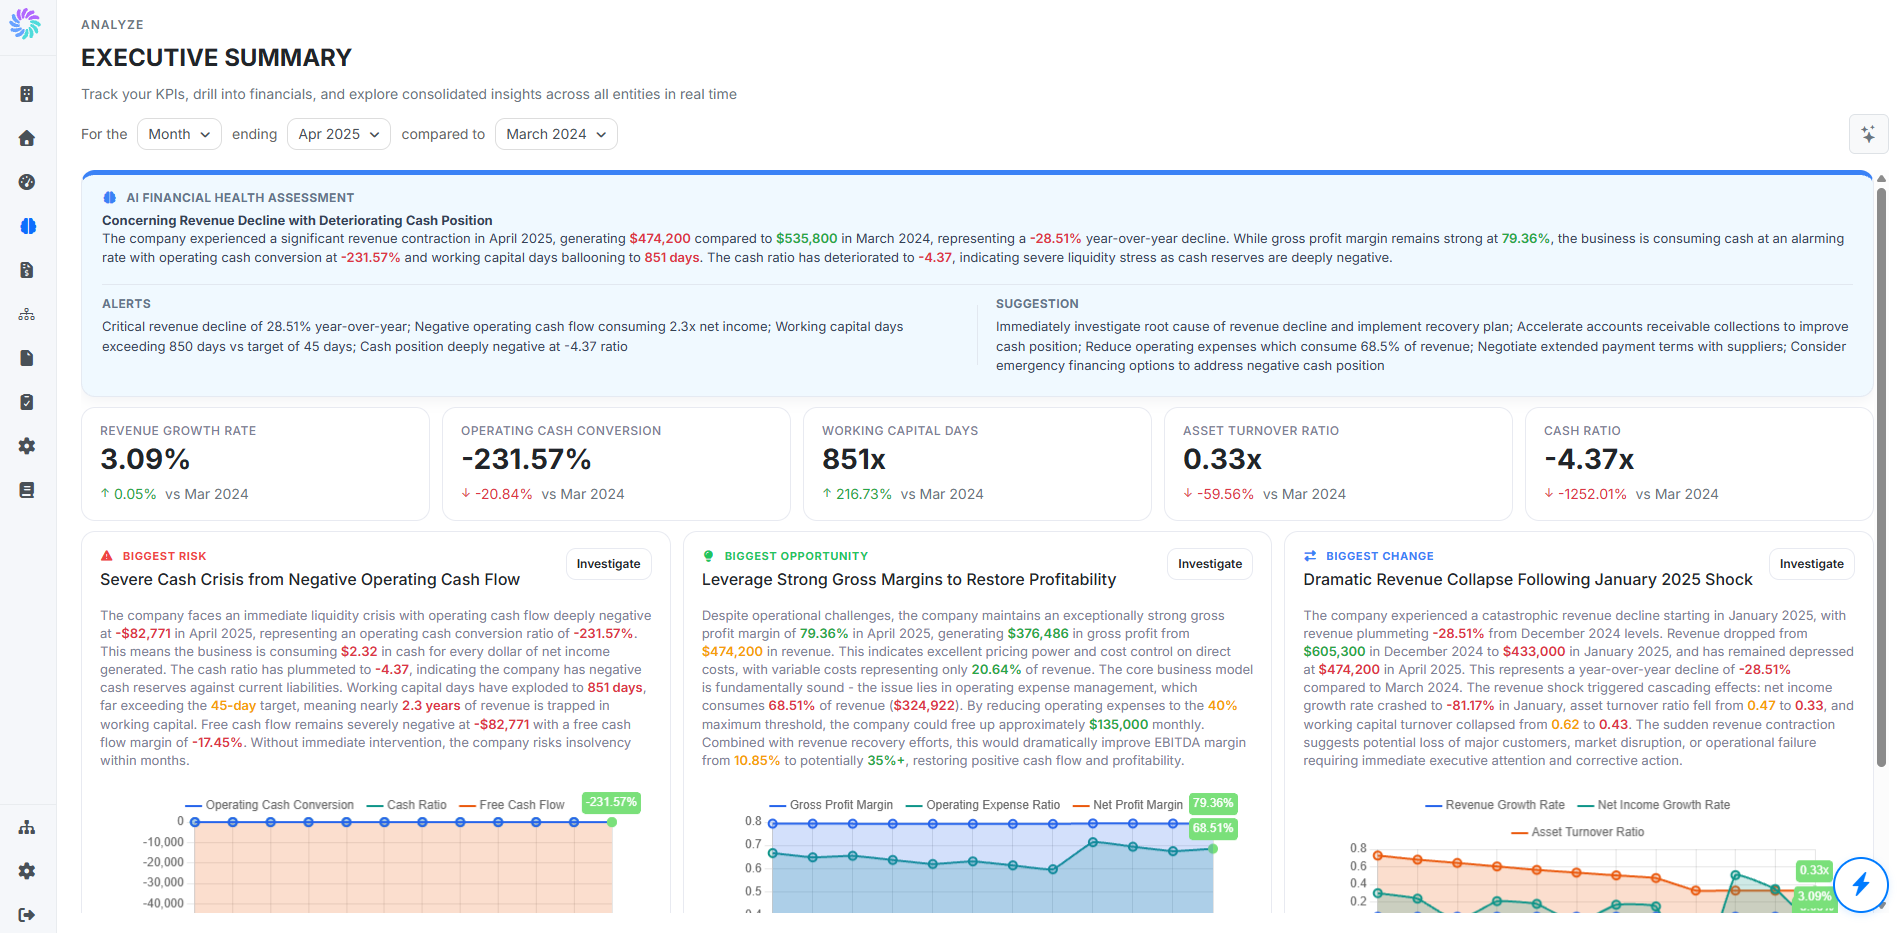
The page opens with the AI Financial Health Assessment at the top, a row of KPI tiles beneath it, and three cards (Biggest Risk, Biggest Opportunity, Biggest Change) below the tiles.
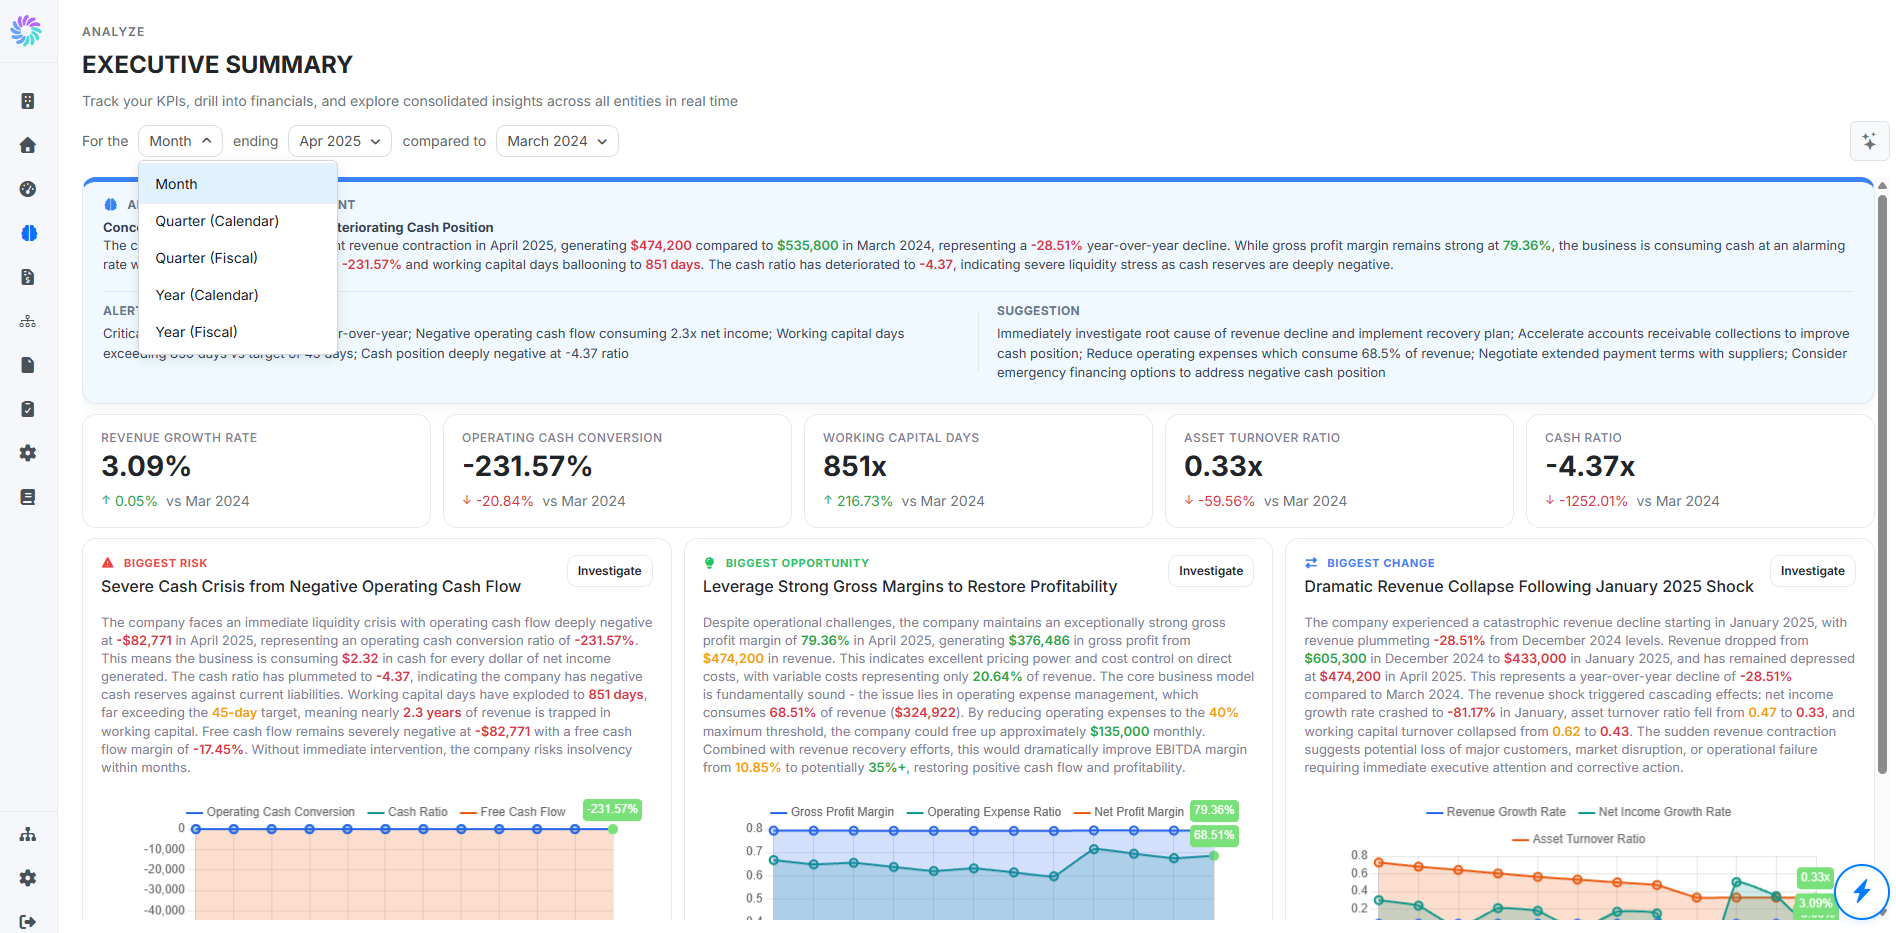
Step 2. Set the Period and Comparison
The controls at the top of the page define the analysis:
- For the [Period Type]: choose Month, Quarter (Calendar), Quarter (Fiscal), Year (Calendar), or Year (Fiscal)
- Ending [Date]: the period the summary covers (for example,
Apr 2024for a fiscal year ending April 2024) - Compared to: the prior period to benchmark against, defaulting to the immediately prior period of the same type
The summary regenerates automatically when any of these change.
Step 3. Read the AI Financial Health Assessment
The blue panel at the top opens with a one-line headline followed by a paragraph of narrative analysis. Below the narrative are two callouts:
- Alerts: risks the AI has flagged as needing attention, such as working capital days breaching target or cash conversion declining
- Suggestion: concrete actions tied to the alerts, such as renegotiating supplier terms or accelerating collections
This panel is the "what should I know in one minute" view. Read it first, then move down to the numbers.
Step 4. Review the KPIs and the Three Biggest Cards
A row of KPI tiles sits below the assessment. Each tile shows the metric name, the current period value, and the change versus the comparison period. The metrics displayed adapt to your AI Summary Preferences, so a profitability-focused setup will surface growth metrics, while a cash-flow-focused setup will surface cash conversion, AP turnover, free cash flow, and similar.
Below the KPI row are three cards:
- Biggest Risk: the most material problem the AI has identified
- Biggest Opportunity: the most material strength or upside
- Biggest Change: the most significant period-over-period shift
Each card contains a headline, a paragraph of analysis, and a small chart, with the underlying numbers in context (current value, comparison value, percentage change, target where relevant) so you can read it without flipping back to the financial statements.
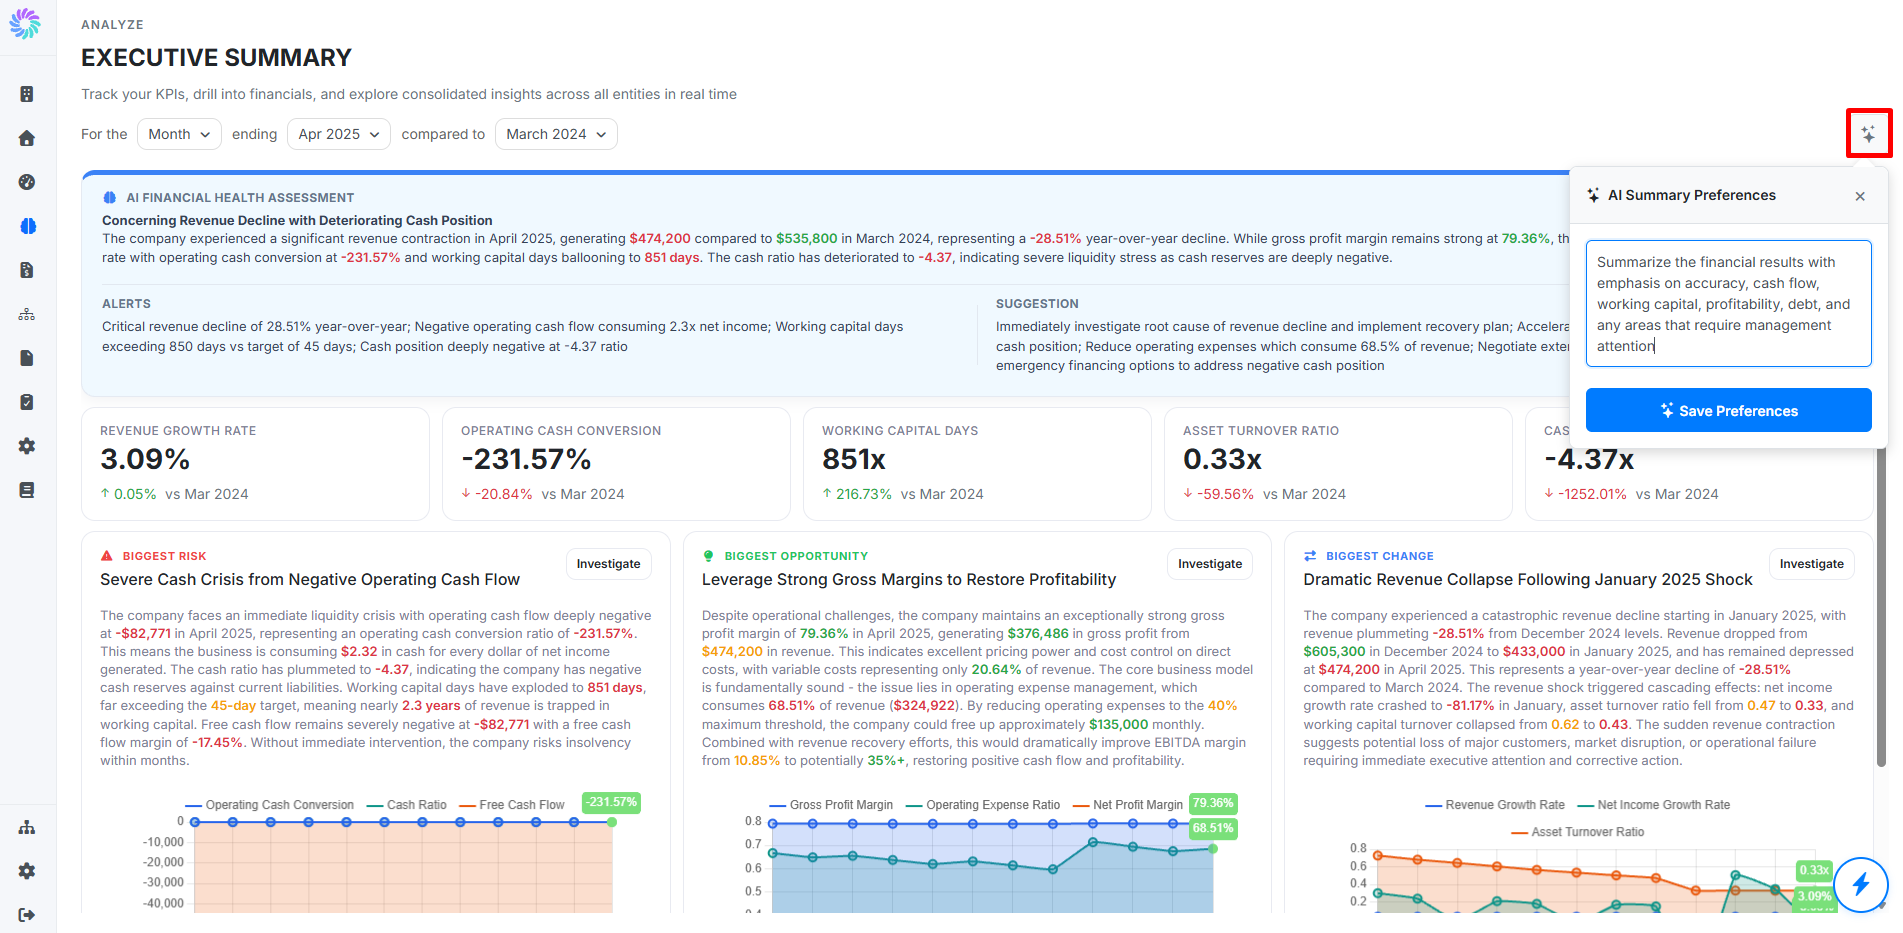
Step 5. Customize with AI Summary Preferences
If the default summary is not focused on what you care about, click the AI icon at the top right of the page to open AI Summary Preferences. Type a prompt describing what you want the AI to emphasize, for example:
Summarize the financial results with emphasis on accuracy, cash flow, working capital, profitability, debt, and any areas that require management attention.
Click Save Preferences. The summary regenerates with the new focus, and the headline, narrative, alerts, KPI tiles, and three Biggest cards all shift to reflect the prompt.
Step 6. Investigate a Finding
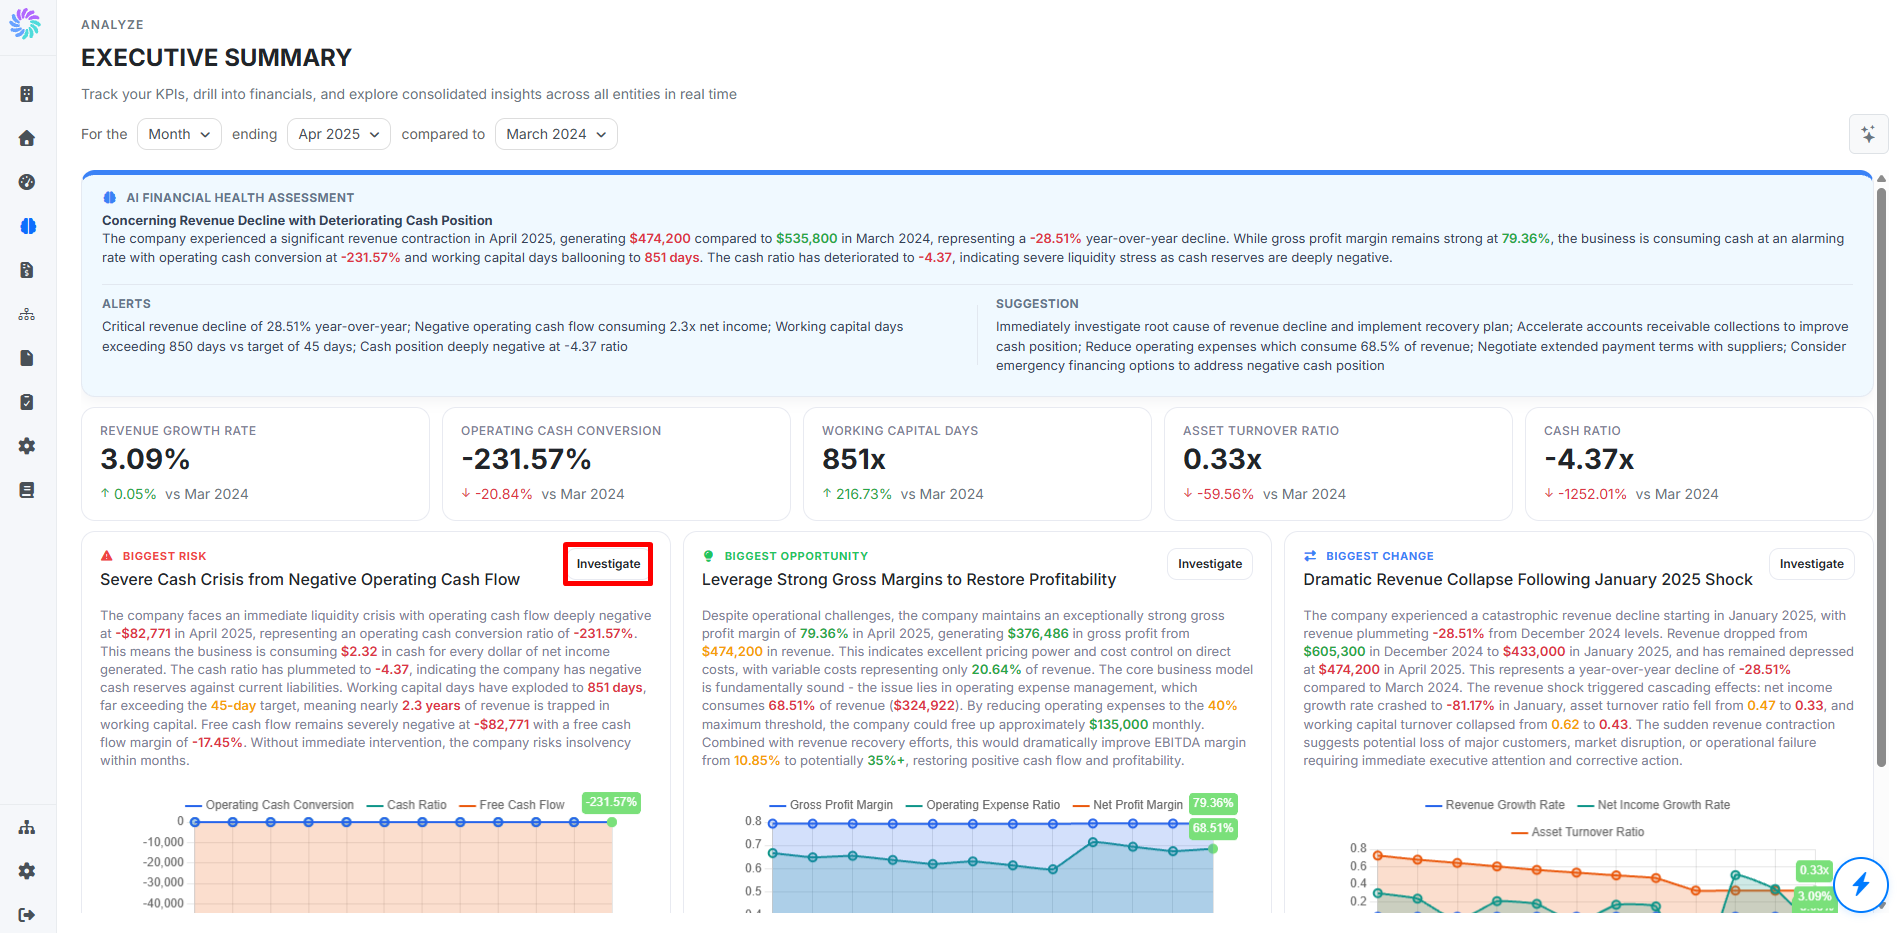
Each of the three Biggest cards has an Investigate button in the top right corner. Click it to open Account Intelligence, pre-filtered for the accounts behind the finding. From there, you can see the bar chart breakdown, root cause analysis, and the underlying account composition.
This is the main hand-off out of the Executive Summary. The page is a triage tool, and Investigate is how you move from "what" to "why." For details on what to do once you arrive, see the Account Intelligence article.